Descripción
El TrendFibonacci indicador está diseñado para ayudar a los traders a identificar niveles críticos de precio y tendencias del mercado con precisión. Al integrar niveles de retroceso de Fibonacci con una Media Móvil Ponderada (WMA) y el Rango Verdadero Promedio (ATR), este indicador proporciona una representación visual clara del soporte, resistencia y dirección de la tendencia.
Características clave:
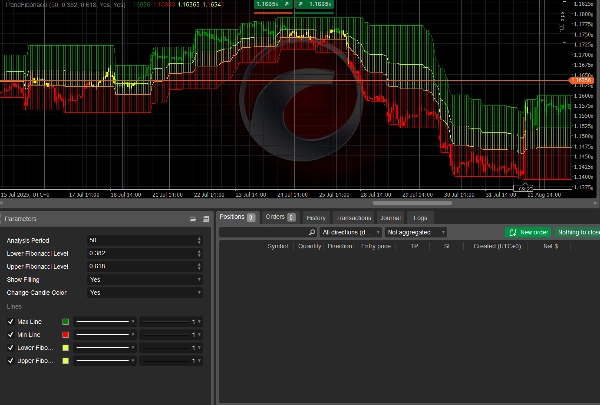
- Niveles Dinámicos de Fibonacci: Calcula y traza automáticamente los niveles de retroceso de Fibonacci (por defecto: 0.382 y 0.618) basándose en el máximo más alto y el mínimo más bajo durante un período de retroceso definido por el usuario.
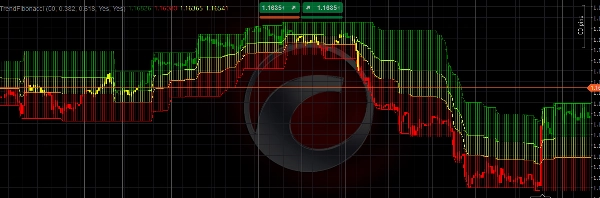
- Media Móvil Ponderada (WMA): Utiliza una WMA de 6 períodos para medir la dirección de la tendencia, con velas codificadas por colores (Verde para alcista, Rojo para bajista, Amarillo para neutral) para reflejar la posición de la WMA en relación con los niveles de Fibonacci.
- Parámetros Personalizables: Ajusta el período de análisis, los niveles de Fibonacci y activa o desactiva funciones como zonas rellenas y cambios de color en las velas.
- Claridad Visual: Traza líneas de máximo/mínimo y rellena áreas entre niveles de Fibonacci con colores semitransparentes para facilitar la identificación de tendencias.
- Integración ATR: Incorpora un ATR de 200 períodos para un análisis robusto del mercado, asegurando adaptabilidad a la volatilidad.
Este indicador es ideal para traders que buscan combinar el análisis de Fibonacci con estrategias de seguimiento de tendencias. Ya sea que operes en forex, acciones o commodities, TrendFibonacci mejora tu capacidad para detectar zonas clave de reversión y tomar decisiones de trading informadas.
Cómo usar
- Instalar el Indicador:
-
- Agrega el TrendFibonacci indicador a tu plataforma cTrader subiendo el código fuente o descargándolo desde el marketplace.
- Configurar Parámetros:
-
- Período de Análisis: Establece el período de retroceso (por defecto: 50 barras) para determinar el rango para calcular precios máximos/mínimos.
- Nivel Inferior de Fibonacci: Ajusta el nivel inferior de retroceso de Fibonacci (por defecto: 0.382).
- Nivel Superior de Fibonacci: Ajusta el nivel superior de retroceso de Fibonacci (por defecto: 0.618).
- Mostrar Relleno: Activa o desactiva las zonas rellenas entre niveles de Fibonacci (por defecto: activado).
- Cambiar Color de Velas: Activa o desactiva las velas codificadas por color según la posición de la WMA (por defecto: activado).
- Interpretar el Indicador:
-
- Velas Verdes: Indican una tendencia alcista cuando la WMA está por encima del nivel superior de Fibonacci.
- Velas Rojas: Señalan una tendencia bajista cuando la WMA está por debajo del nivel inferior de Fibonacci.
- Velas Amarillas: Sugieren una zona neutral cuando la WMA está entre los niveles de Fibonacci.
- Zonas Rellenas: Visualizan zonas clave de precio entre las líneas de máximo/mínimo y los niveles de Fibonacci para análisis de soporte/resistencia.
- Aplicación en Trading:
-
- Usa el indicador para identificar posibles puntos de entrada/salida en los niveles de Fibonacci.
- Combínalo con otras herramientas técnicas (p. ej., RSI, MACD) para confirmación.
- Monitorea las velas codificadas por color para evaluar la fuerza y dirección de la tendencia.
- Mejores Prácticas:
-
- Prueba el indicador en una cuenta demo para familiarizarte con su comportamiento.
- Ajusta los parámetros para adecuarlos a tu estilo de trading y condiciones del mercado.
- Úsalo en marcos temporales mayores (p. ej., H1, H4) para señales más confiables.
El TrendFibonacci indicador es una herramienta versátil para traders de todos los niveles, ofreciendo insights claros y accionables sobre tendencias del mercado y niveles de precio.
Resumen
Users can customize parameters such as the analysis period, Fibonacci levels, and visual features like filled zones between Fibonacci levels and candle color changes. The indicator visually highlights support and resistance zones by plotting high/low lines and filling areas between Fibonacci levels with semi-transparent colors. It is applicable across various markets including forex, stocks, commodities, and popular symbols like BTCUSD, EURUSD, GBPUSD, and XAUUSD.
TrendFibonacci supports traders in spotting potential entry and exit points at Fibonacci levels and can be combined with other technical tools like RSI and MACD for confirmation. It is recommended for use on higher timeframes (e.g., H1, H4) to enhance signal reliability.