
Description
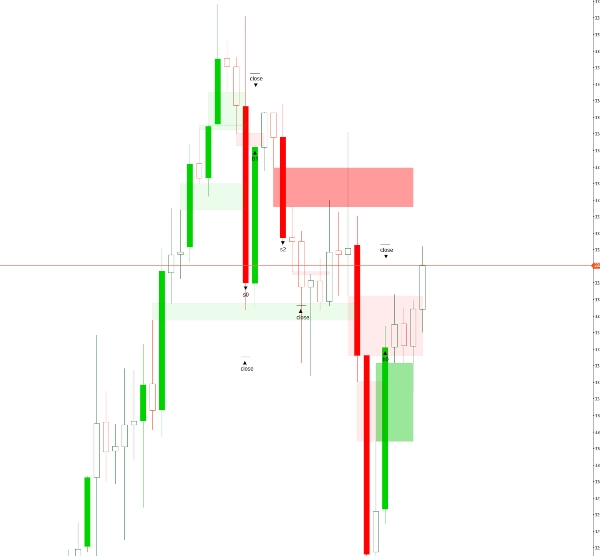
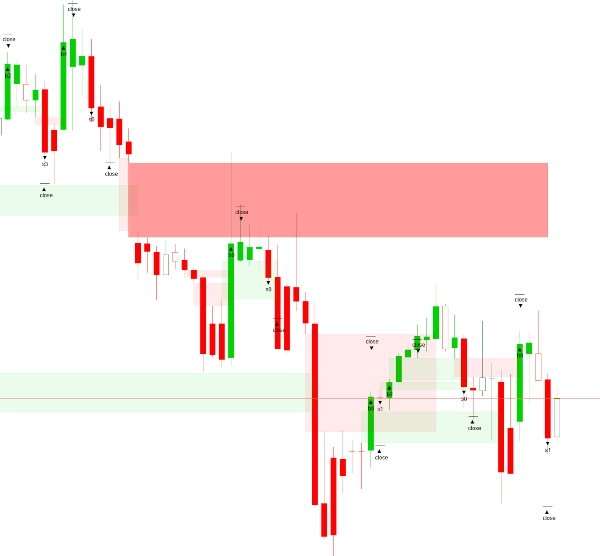
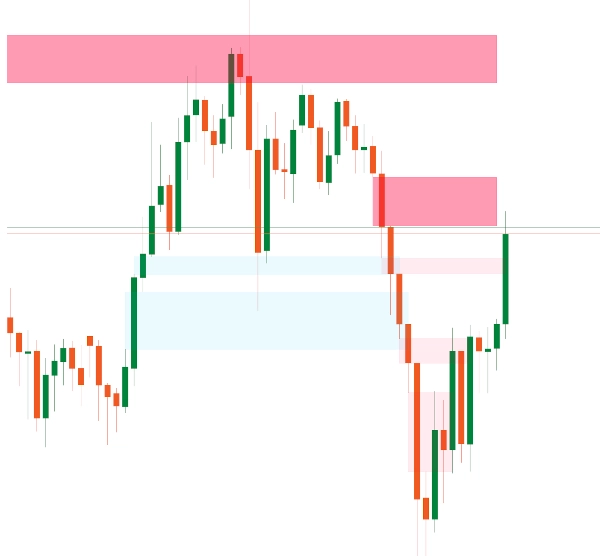
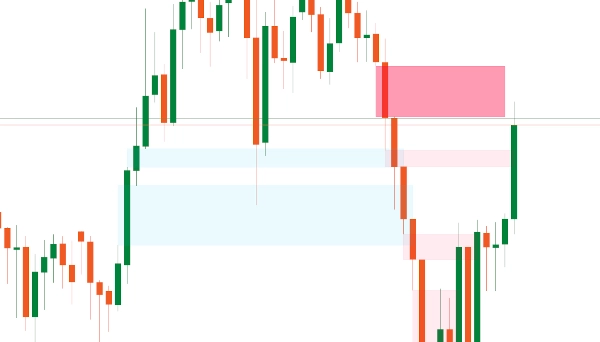
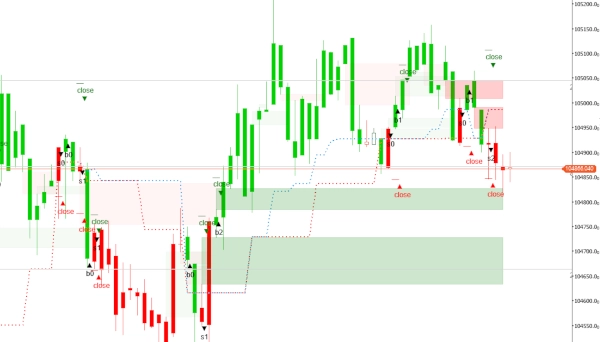
Cet indicateur Fair Value Gap (FVG) est un outil d'analyse technique conçu pour détecter les inefficacités de prix sur les marchés financiers. Il identifie les zones où le prix a rapidement augmenté ou chuté, laissant derrière lui un « gap » — une zone avec peu ou pas d'activité de trading. Ces gaps signalent souvent un déséquilibre temporaire entre l'offre et la demande, suggérant que le prix pourrait éventuellement revenir « combler » ce vide alors que le marché cherche un équilibre. En général, un FVG est reconnu lorsqu'une bougie de prix se ferme significativement au-dessus du plus haut ou en dessous du plus bas de la bougie précédente sans chevauchement, indiquant une zone de réaction potentielle. Ce comportement est souvent associé au trading institutionnel ou à une activité algorithmique. Alors que la plupart des versions de cet indicateur analysent les déséquilibres sur une seule unité de temps, la version premium ajoute de la polyvalence en détectant et affichant les gaps provenant d’unités de temps supérieures ou inférieures directement sur le graphique actuel, offrant un contexte plus approfondi pour une analyse multi-temporelle.
Aperçu des paramètres
- Barres à charger : Spécifie le nombre de barres historiques à analyser, en commençant par la plus récente terminée et en remontant dans le temps.
- Couleur FVG haussière : Définit la couleur des FVG apparaissant dans une tendance haussière. Une transparence de 30 % est appliquée afin que les éléments derrière le gap restent visibles.
- Couleur FVG baissière : Définit la couleur des FVG apparaissant dans une tendance baissière, également avec une transparence de 30 % pour une meilleure visibilité sur le graphique.
Fonctionnalités Premium (disponibles dans la version payante)
- Supprimer les gaps fermés : Un paramètre booléen — lorsqu’il est activé (« yes »), il supprime automatiquement tous les gaps fermés ; s’il est désactivé (« no »), les gaps restent visibles. Ceci est particulièrement utile sur les unités de temps inférieures (moins de 20 minutes).
- Modifier/Supprimer les gaps : Permet aux traders d’ajuster ou de supprimer manuellement les gaps. Cela offre aux traders expérimentés un meilleur contrôle, surtout que les gaps très petits ont généralement peu d’influence sur le mouvement des prix.
- Définir l’unité de temps : Propose deux options — utiliser l’unité de temps du graphique actuel ou en sélectionner une différente pour l’analyse, tout en affichant les résultats sur le graphique principal. Cette fonctionnalité aide les traders à obtenir plus rapidement des indications sur les mouvements probables du marché.
- Unité de temps sélectionnée : Spécifie l’unité de temps souhaitée pour l’analyse si « Selected Timeframe » est choisie dans le paramètre ci-dessus.
- Précision des petits gaps : Permet aux traders d’entrer une taille de gap préférée en entier, les aidant à identifier les gaps qui ont historiquement conduit à des résultats favorables. La valeur est basée sur l’ensemble des données et les tailles de gaps observées pour l’actif.
Par défaut, l’indicateur analyse tous les déséquilibres dans une seule unité de temps. Cependant, l’accès aux fonctionnalités premium via la FairValueGapPremium version peut grandement améliorer les capacités analytiques.
Résumé
This indicator detects such gaps to highlight potential reaction zones. By default, it analyzes imbalances within a single timeframe. The premium version enhances functionality by allowing detection and display of FVGs from higher or lower timeframes directly on the current chart, supporting multi-timeframe analysis.
Key settings include the number of historical bars to analyze and customizable colors for bullish and bearish gaps with transparency for chart clarity. Premium features offer options to automatically delete closed gaps, manually edit or remove gaps, select analysis timeframes independent of the chart’s timeframe, and specify gap size accuracy to focus on significant gaps.
This tool aids traders in identifying price inefficiencies and probable market reaction areas through detailed gap analysis across multiple timeframes.
Avis clients
5 | 100 % | |
4 | 0 % | |
3 | 0 % | |
2 | 0 % | |
1 | 0 % |


