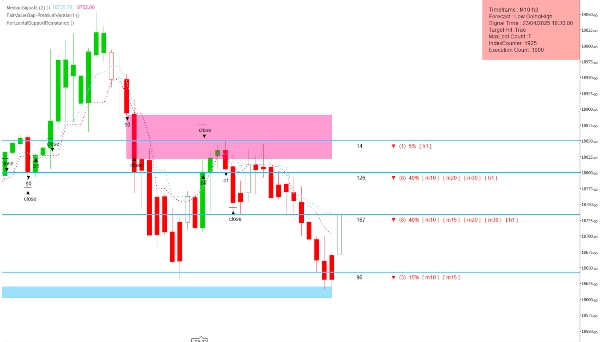
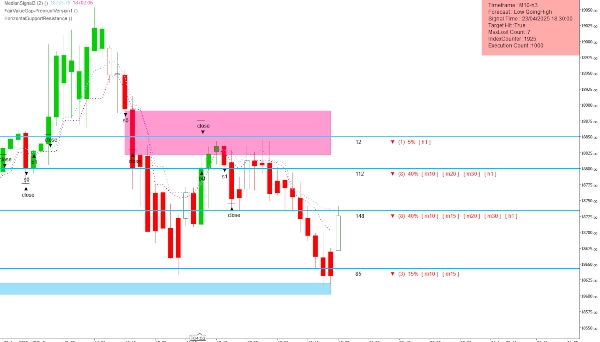
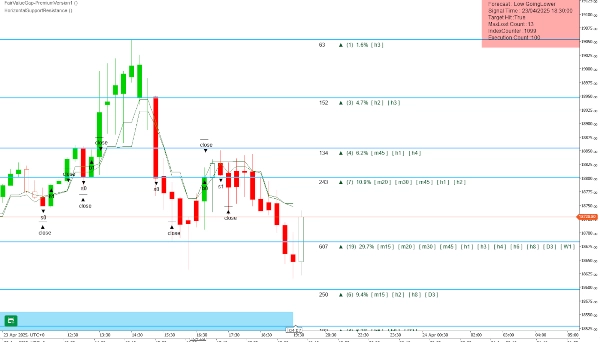
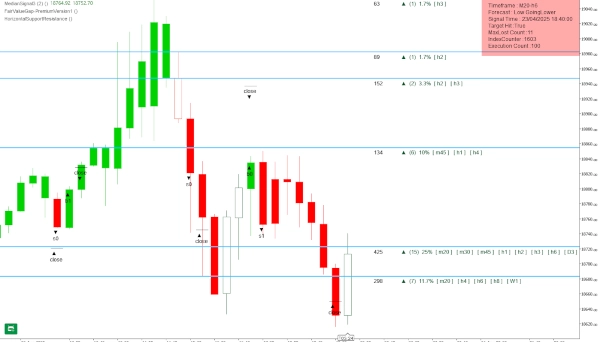
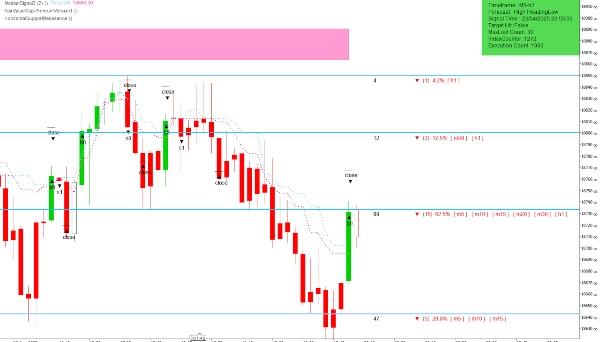
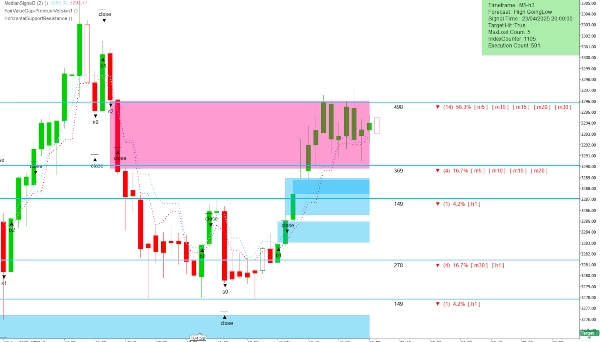
Courtiers & props
Pour entreprise
00
Days
:
00
Hours
:
00
Minutes
:
00
Seconds
HorizontalSupportResistance
Indicateur
607 téléchargements
Version 1.0, Apr 2025
Windows, Mac
4.5
Avis : 2
Depuis le 19/04/2025
Volume tradé
284.21M
Pips gagnés
1.07M
Ventes
8
Installations gratuites
2587
Image mise en ligne de "HorizontalSupportResistance"Image mise en ligne de "HorizontalSupportResistance"Image mise en ligne de "HorizontalSupportResistance"Image mise en ligne de "HorizontalSupportResistance"Image mise en ligne de "HorizontalSupportResistance"Image mise en ligne de "HorizontalSupportResistance"

This extraordinary multi timeframe support and resistance indicator is nothing short of market wizardry. Designed with precision and backed by smart logic, it identifies critical price levels on all forex, indices, or stocks but especially on the NASDAQ100 with uncanny accuracy. Like a seasoned trader’s intuition encoded into a visual tool, it highlights key zones where price reacts, reverses, or accelerates—giving you an edge that feels almost supernatural. With clean candlestick representation and vibrant, clearly marked levels, this indicator doesn’t just follow the market—it anticipates it. Whether you're scalping short-term moves or holding longer-term positions, this tool acts like your personal trading oracle, quietly guiding you to smarter, more confident decisions.

4.5
Avis : 2
5
50 %
4
50 %
3
0 %
2
0 %
1
0 %
Avis clients
August 12, 2025
Pros: Accurate auto SR levels, customizable appearance, lightweight. Cons: No level strength filter, no alerts, possible chart clutter.
June 20, 2025
The Indicator is excellent, What's the core logic of this Indicator, Kindly share if you don't mind.
Indices
Stocks
Forex
GBPUSD
Scalping

Plus de cet auteur

Les mieux notés
Gratuit
FairValueGap
This Fair Value Gap (FVG) indicator is a technical analysis tool used to identify potential price imbalances.
FairValueGap-PremiumVersion1
This Fair Value Gap (FVG) indicator is a technical analysis on multi-timeframe.
Les mieux notés
Gratuit
BarSentiments
This Indicator is a technical analysis tool that measures the strength and direction of market sentiment

Vous pourriez aussi aimer

Indicateur
Indices
RSI
XAUUSD
+8
MACARX 2026 ULTRA
🚀 MACARX Indicator - The Multi-Indicator Trend Fusion 🚀
Indicateur
RSI
Breakout
XAUUSD
+7
Candle Strength Oscillator
The Candle Pressure Index is a powerful, user-friendly indicator that reveals hidden market pressure inside candles.
Indicateur
RSI
Breakout
XAUUSD
+5
Auto-Trend Channel
Adaptive trend channel using linear regression and Pearson correlation for dynamic support, resistance, and trends.
Indicateur
NZDUSD
XAUUSD
Stocks
+7
Signals Volatility Cloud Breakout
🎯Generate precise BUY/SELL signals. 📈🎯 Tracks trends with colored candles & clouds.
Indicateur
NAS100
NZDUSD
XAUUSD
+10
Tsunami Volume Surge - RVOL
🌊 See when the market is truly in play. Tsunami measures Relative Volume by time-of-day 🌊
Indicateur
Breakout
Scalping
KAMAKeltner
KAMA Keltner – Adaptive Volatility Channel for Precision Trading
Indicateur
RSI
Commodities
Signal
+1
Dot Momentum %BB Indicator
Dynamic circles visualize price's volatility position. Like RSI for market overextension & stretch. Quantify context.
Indicateur
VWAP
NAS100
XAUUSD
+7
Vwap Manav Indi Button
Automated VWAP bot executes trades at key volume-weighted average price zones with adaptive risk management
VolumeRenkoRange
Volume for Renko/Range
Indicateur
Grid
NAS100
NZDUSD
+17
ICT HTF Candles_Majob
ICT HTF Candles- The Ultimate Multi-Timeframe Dashboard Stop switching timeframes and losing focus.
Indicateur
Bollinger
E7 Indicators Free Studies
ADXR, KDJ, SineWave, Bollinger Band Volatility and AEOscillator.
Indicateur
NAS100
Indices
Prop
+5
Stochastic confluence
Stochastic Confluence Pro (RSI + Divergence)