
FairValueGap
Indicateur
2.15K téléchargements
Version 1.0, Apr 2025
Windows, Mac
4.5
Avis : 2
Description
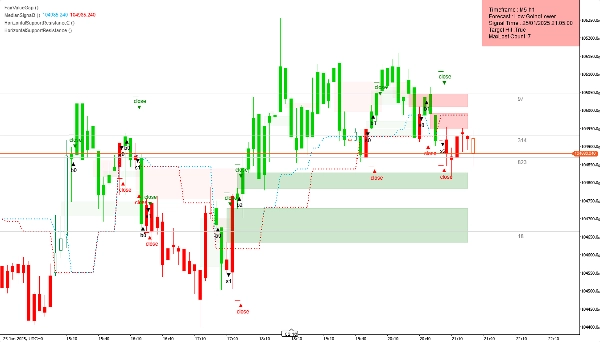
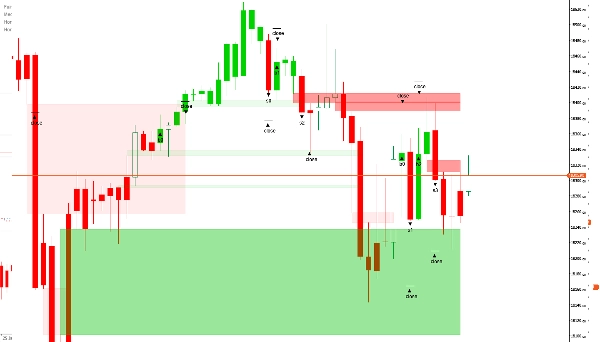
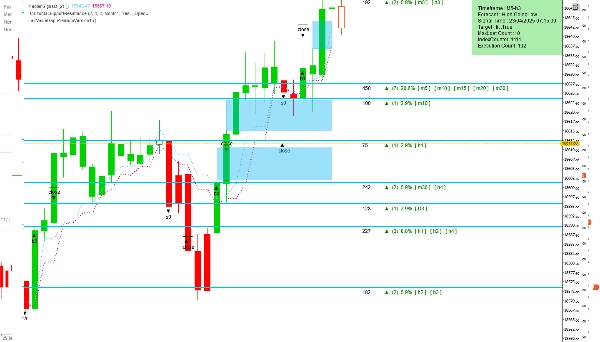
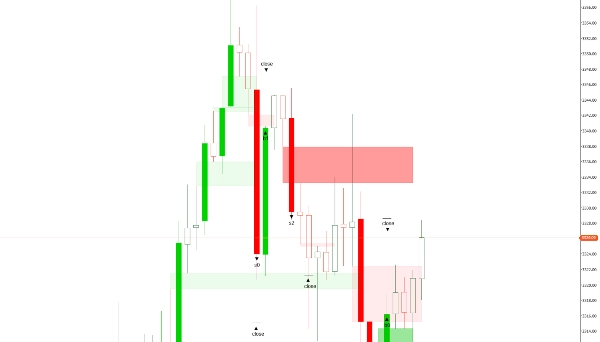
L'indicateur Fair Value Gap (FVG) est un outil d'analyse technique conçu pour identifier les déséquilibres potentiels des prix sur le marché. Ces écarts se produisent lorsque le prix évolue rapidement, créant une zone avec une activité de trading minimale — souvent appelée « vide ». De tels déséquilibres peuvent indiquer une probabilité de retracement des prix, car le marché tend à rechercher l'équilibre en revisitant ces zones.
Aperçu des paramètres
- Barres à charger : Spécifie le nombre de barres historiques à analyser, en commençant par la plus récemment terminée et en remontant dans le temps.
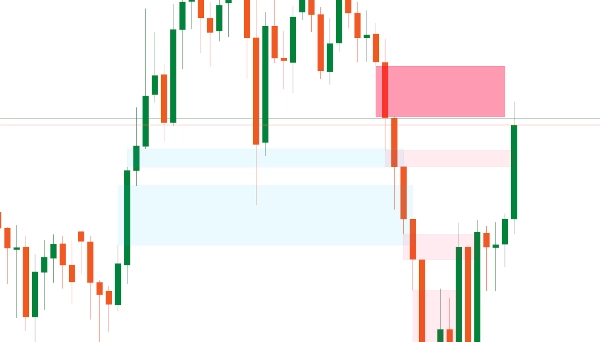
- Couleur FVG haussière : Définit la couleur des FVG apparaissant dans une tendance haussière. Une transparence de 30 % est appliquée afin que les éléments derrière l'écart restent visibles.
- Couleur FVG baissière : Définit la couleur des FVG apparaissant dans une tendance baissière, également avec une transparence de 30 % pour une meilleure visibilité du graphique.
Fonctionnalités Premium (disponibles dans la version payante)
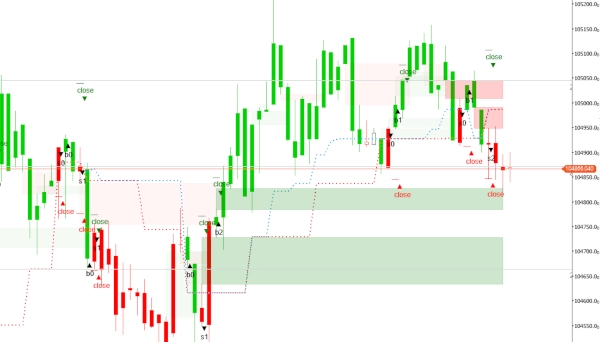
- Supprimer les écarts fermés : Un paramètre booléen — lorsqu'il est activé (« oui »), il supprime automatiquement tous les écarts fermés ; s'il est désactivé (« non »), les écarts restent visibles. Ceci est particulièrement utile sur des unités de temps inférieures à 20 minutes.
- Modifier/Supprimer les écarts : Permet aux traders d'ajuster ou de supprimer manuellement les écarts. Cela offre aux traders expérimentés un contrôle accru, surtout que les écarts très petits ont généralement peu d'influence sur le mouvement des prix.
- Définir l'unité de temps : Propose deux options — utiliser l'unité de temps actuelle du graphique ou en sélectionner une différente pour l'analyse, tout en affichant les résultats sur le graphique principal. Cette fonctionnalité aide les traders à obtenir plus rapidement des informations sur les mouvements probables du marché.
- Unité de temps sélectionnée : Spécifie l'unité de temps souhaitée pour l'analyse si « Unité de temps sélectionnée » est choisie dans le paramètre ci-dessus.
- Précision des petits écarts : Permet aux traders d'entrer une taille d'écart préférée en entier, les aidant à identifier les écarts qui ont historiquement conduit à des résultats favorables. La valeur est basée sur l'ensemble des données et les tailles d'écarts observées pour l'actif.
Par défaut, l'indicateur analyse tous les déséquilibres dans une seule unité de temps. Cependant, l'accès aux fonctionnalités premium via la FairValueGapPremium version peut grandement améliorer les capacités analytiques.
Résumé
Résumé IA
The Fair Value Gap (FVG) indicator is a technical analysis tool that identifies potential price imbalances in the market. These imbalances, or "gaps," occur when price moves rapidly, creating zones with minimal trading activity, often called "voids." Such areas may signal likely price retracements as the market tends to revisit these zones to restore balance.
Key settings include:
- Bars To Load: number of historical bars analyzed from the most recent backward.
- Bullish FVG Color: customizable color for gaps in uptrends with 30% transparency.
- Bearish FVG Color: customizable color for gaps in downtrends with 30% transparency.
Premium features (available in the paid version) enhance functionality by allowing:
- Automatic deletion of closed gaps, useful for lower timeframes.
- Manual editing or removal of gaps for finer control.
- Selection of analysis timeframe independent of the chart’s timeframe.
- Input of preferred gap size to improve identification accuracy based on historical data.
By default, the indicator scans imbalances within a single timeframe, with premium options providing expanded analytical capabilities.
Profil de l'indicateur
Avis clients
4.5
Avis : 2
5 | 50 % | |
4 | 50 % | |
3 | 0 % | |
2 | 0 % | |
1 | 0 % |
Avis clients
August 12, 2025
Pros: Automatically highlights the first session FVG and extends it to session end. Clean, minimal interface ideal for intraday analysis. Cons: No alerts or tooltips. Cannot save templates or track past session gaps.
August 6, 2025
Discussion
Questions fréquentes
Les produits disponibles sur cTrader Store, notamment les bots de trading, les indicateurs et les plug-ins, sont fournis par des développeurs tiers et mis à disposition à titre informatif et à des fins d'accès technique uniquement. cTrader Store n'est pas un courtier et ne fournit aucun conseil en investissement, aucune recommandation personnelle ni aucune garantie quant aux performances futures.
Plus de cet auteur


Prix
Depuis le 19/04/2025
284.21M
Volume tradé
1.08M
Pips gagnés
8
Ventes
3.46K
Installations gratuites