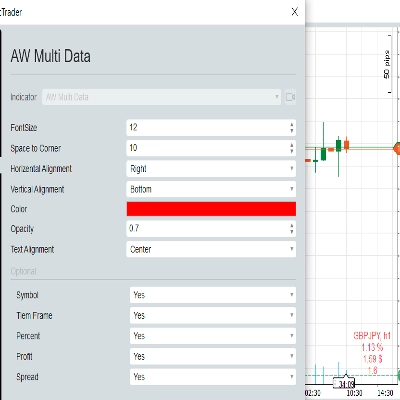
present
Inscrivez-vous et bénéficiez d'une remise de 50 $ sur votre premier achat
Trading product for IR Multi Data Indicateur, image 1
IR Multi Data
5.0
Avis : 1
5.63K
Installations gratuites

Description

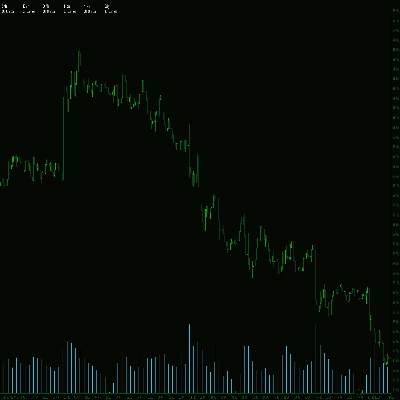
afficher le symbole et l'intervalle de temps, le pourcentage de profit net quotidien, le profit net quotidien, et le spread dans votre graphique.

considérez que le fuseau horaire est réglé sur utc pour afficher correctement le profit quotidien.

Résumé

Résumé IA
IR Multi Data is a trading indicator that displays key trading metrics directly on your chart. It shows the symbol and timeframe, daily net profit percentage, daily net profit amount, and spread. The indicator requires the timezone to be set to UTC to accurately reflect daily profit values. This tool is designed to provide traders with quick access to essential performance data within their charting environment.
Profil de l'indicateur

Discussion

Avis clients

5.0
Avis : 1
5
100 %
4
0 %
3
0 %
2
0 %
1
0 %
Avis clients
September 3, 2025
اختيار موفق لك الحمد

Questions fréquentes

Les produits disponibles sur cTrader Store, notamment les bots de trading, les indicateurs et les plug-ins, sont fournis par des développeurs tiers et mis à disposition à titre informatif et à des fins d'accès technique uniquement. cTrader Store n'est pas un courtier et ne fournit aucun conseil en investissement, aucune recommandation personnelle ni aucune garantie quant aux performances futures.

Plus de cet auteur

Logo de "IR Candle MTF"
4.6
(6)
Gratuit
with this indicator you could see other time frame candle in your chart.
show spread on chart
some user add moving average to macd to see better. in ctrader 4.3.11 there is a problem with this . I make a macd tha
this indicator show macd on chart.
Multi Time Frame Moving Average is a powerful and flexible indicator for cTrader
 this moving include everything that a trader needs from Moving Average.
this indicaotr show distance between Tenkan to Kijun, Close to Kijun and Close to Tenkan 
Add Slowing to IR Moving Average.
IR Candle Open plots customizable opening price lines for daily, weekly, and monthly candles
Coral indicator
you could put your check list in your chart you could split your test with “,” you could put your checklist in indicat
this indicator show other time frame close in lower time frame. for ex: show daily close in m 15.

Vous pourriez aussi aimer

Stay ahead with a real-time countdown to candle closes on all key timeframes: 5m, 15m, 30m, 1H, 4H, and Daily.
Indicator for my Bot
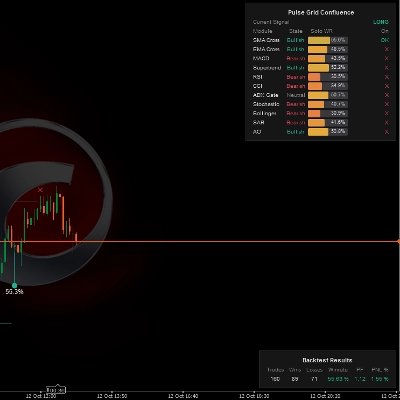
Multi-indicator confluence HUD & real-time backtest engine to detect trend alignment and filter high-probability setups.
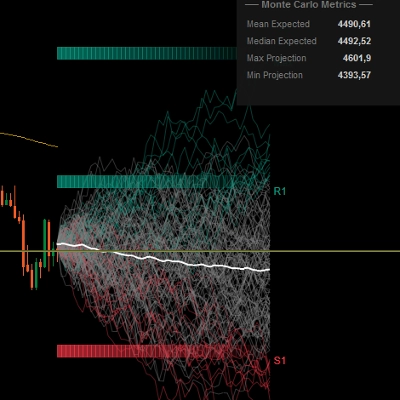
Predictive Monte Carlo Engine Forecast future price paths using institutional-grade statistical models and probability
Identify key support and resistance levels through detailed volume distribution analysis.
Market Profile TPO for cTrader — full auction logic, IB, POC, VA zones, histogram and O/X markers with time
Volume profile key levels - POC, value area, volume peaks and troughs - with break, rejection and retest signals
Clean structure-analysis indicator with BOS/CHoCH context and virgin Fair Value Gaps for cTrader traders.
UT Bot Alerts Nova: Advanced trend-following indicator using ATR for signals. Precise entries/exits.
Multi VWAP. Three timeframes. One clean chart. Your Essential Trading Tool.
Explore 88 harmonic price-pattern variants with interactive chart controls and geometric reference levels.
Bolliger Bands + Hamster-Coder™ Timeframe Decoupling
Fair Value Gaps with Multi-Timeframe.
PrimeTrend: ATR trendline detects reversals, plots entry/SL/3 targets. Tune params (speed vs. robustness). Backtest +
Supertrend Indicator
Detects CHoCH breakouts, draws interest zones & auto Fibo. Built for Smart Money & Price Action Engulfing confirmation
Instantly spot high-liquidity institutional moves with clean, non-obtrusive triangle alerts on cTrader charts.
Allow trader to visualize Support & Resistance across different timeframes,give trader an overview of the current market

Prix

5.63K
Installations gratuites