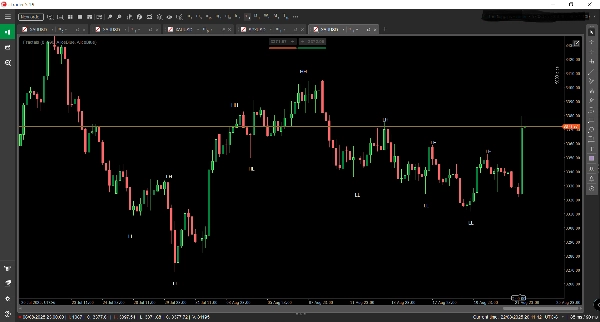
Courtiers & props
Pour entreprise
00
Days
:
00
Hours
:
00
Minutes
:
00
Seconds
Fractals
Indicateur
2 achats
Version 1.0, Aug 2025
Windows, Mac
Depuis le 08/08/2025
Ventes
13
Installations gratuites
1468
Image mise en ligne de "Fractals"

🧠 Fractals – Market Structure Visualized

Fractals is a precision-engineered trading indicator for cTrader that reveals the hidden architecture of price action. By automatically detecting and labeling Higher Highs (HH), Higher Lows (HL), Lower Highs (LH), and Lower Lows (LL) directly on the chart, Fractals transforms raw price data into a clear, actionable map of market structure.

🔍 Key Features:

  • Real-Time Structure Mapping: Instantly identifies swing points and labels them to expose trend direction and reversal zones.
  • Multi-Timeframe Awareness: Designed to highlight macro structure on higher timeframes, giving traders a strategic edge in aligning entries with dominant trends.
  • Trend Following Optimization: Ideal for traders using momentum, breakout, or pullback strategies, helping confirm bias and avoid counter-trend traps.
  • Clean Visual Overlay: Elegant chart annotations that integrate seamlessly with any trading setup, enhancing clarity without clutter.

🧭 Use Cases:

  • Spot emerging trends and structural shifts before they’re obvious.
  • Validate trade setups with structural confirmation.
  • Combine with moving averages, volume, or custom indicators for layered confluence.
  • Perfect for manual backtesting and prop firm evaluations where structure-based logic is key.
0.0
Avis : 0
Avis clients
Il n'y a pas encore d'avis sur ce produit. Vous l'avez déjà essayé ? Soyez le premier à en parler aux autres !
Indices
Prop
Commodities
Stocks
Forex
Crypto

Plus de cet auteur

FVG
The Indicator is a powerful tool for price-action traders seeking to identify and exploit short-term imbalances.
Indicateur
Indices
XAUUSD
Breakout
+3
AnchoredVWAP
A precision overlay tool that combines session-aware VWAP logic and standard deviations.
Indicateur
Grid
NAS100
XAUUSD
+6
AutoFibRetracement
A powerful overlay tool designed to automatically plot Fibonacci retracement levels based on a custom window.
Indicateur
Indices
Prop
Stocks
+3
Smooth Heiken Ashi
The Smooth Heiken Ashi indicator is a refined charting tool designed to filter out market noise and highlight true price
Indicateur
NAS100
Indices
XAUUSD
+7
T3 Moving Average
A next‑generation moving average designed to deliver exceptional smoothness with minimal lag.
Indicateur
Indices
Prop
Breakout
+3
RVI
A precision-crafted indicator that compares current volume to its historical average for the same time of day.
Indicateur
NAS100
Indices
XAUUSD
+4
PrevDayProjection
Automatically calculates the previous day’s high and low, determines the range, and then projects Fibonacci levels.
cBot
NAS100
Indices
XAUUSD
+4
VolatilityScalper
A trading robot designed for traders who want precision for high-volatility markets (XAUUSD, US500, US100, WTI, others.)
Indicateur
Indices
Breakout
Prop
+6
pATR
An indicator that redefines ATR by applying a percentile-based filter giving traders a grounded view of volatility.
Indicateur
NAS100
Indices
XAUUSD
+7
InstitutionalSignalOscillator
A precision-engineered indicator designed for traders who demand signal integrity across volatile markets.
Indicateur
Breakout
AI
Scalping
KaufmanEfficiencyRatio
A precision tool for measuring how efficiently price moves from point A to B.
Indicateur
NAS100
Indices
XAUUSD
+6
OR Session Zones
A high‑precision Opening Range indicator that detects session opens (NY, London, EU, Tokyo, Shanghai)

Vous pourriez aussi aimer

Previous Day Equilibrium (Premium & Discount)
Plots the equilibrium price levels based on previous daily highs and lows.
Reko Wic
Visualize global Forex trading sessions with clear time blocks for better timing and strategy planning.
Indicateur
Stocks
Forex
Crypto
PinBarCandlestickPattern
PinBarCandlestickPattern Indicator
Indicateur
Martingale
Forex
Fibonacci
+24
Smart Floating Risk-Utimate version
📊 Smart Floating Risk Ultimate.Transform Your Risk Management with Real-Time Intelligence.
Indicateur
RSI
Breakout
Supertrend
All Support and Resistance Levels
"Identify key market zones and visualize support/resistance from multiple timeframes on a single chart.
Indicateur
RSI
XAUUSD
Breakout
+6
Market Imbalance
Identifies market imbalances and visually marks key areas based on price patterns and volatility (ATR).
Indicateur
Indices
RSI
Prop
+6
Screener
Multi-asset screener with real-time RSI/volatility analysis, interactive dashboard, and color-coded trading signals.
Indicateur
NAS100
RSI
NZDUSD
+17
Nadaraya-Watson Indicator
Indicateur
RSI
Signal
MACD
[Stellar Strategies] Moving Averages Combined 1.0
Smooths price action with 6 MAs (3 SMA, 3 EMA). Reduces noise, clarifies trends 📈📉
Indicateur
NAS100
NZDUSD
Breakout
+14
Adaptive Trailing System
🚀 Adaptive trailing stop that uses logarithmic normalized volatility....
Indicateur
Grid
RSI
Breakout
+19
Buy and sell indicator
Buy and Sell Signals