
说明
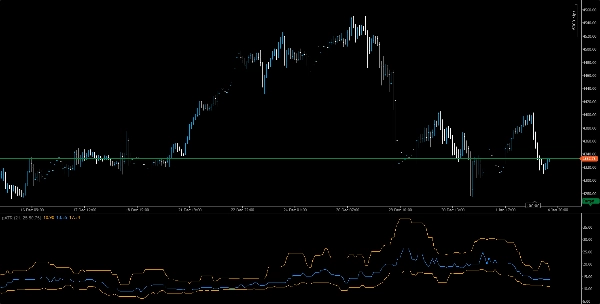
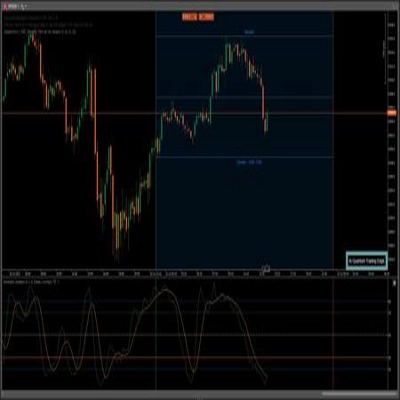
📈 pATR – 百分位平均真实波幅
精准波动率。更智能的风险。机构优势。
该 pATR 指标通过对近期真实波幅值应用基于百分位的过滤器,重新定义了传统的ATR,为交易者提供了一个统计学基础的波动率视角。pATR不是依赖简单平均值,而是计算近期价格波动强度的第n百分位——帮助您精准识别突破区、回撤设置和风险阈值。
无论您是在应对资金管理公司的挑战,还是在优化剥头皮策略,pATR都能提供一个动态的波动率基准,适应市场状况,保持您的风险校准。
🔍 主要特点
• 基于百分位的ATR:过滤噪音和极端事件,提供更清晰的波动信号
• 循环缓冲逻辑:优化速度和内存效率——无延迟,无杂乱
• 挑战模式支持:适合管理回撤和交易限制的资金管理公司交易者
• 清晰视觉效果:橙色波动线,配备直观的缩放和叠加选项
• 多时间框架兼容:可用于M1至H1的突破、回撤或趋势设置
🧠 使用场景
• 突破确认:利用pATR峰值验证动量入场
• 风险校准:根据百分位波动率调整止损和仓位大小
• 策略回测:用一致的波动阈值验证策略设置
🎯 适用对象
• 寻求规则化风险控制的资金管理公司交易者
• 需要自适应波动率过滤器的剥头皮和日内策略交易者
• 将百分位逻辑整合到自定义系统中的量化交易者
• 教授波动率感知执行的教育者和导师
摘要
AI 摘要
pATR (Percentile Average True Range) is a volatility indicator that enhances the traditional Average True Range (ATR) by applying a percentile-based filter to recent true range values. This approach provides a statistically grounded measure of price movement intensity, filtering out noise and extreme events for clearer volatility signals. The indicator uses circular buffer logic for optimized speed and memory efficiency, ensuring no lag in data processing.
Key features include an orange volatility line with intuitive scaling and overlay options, compatibility across multiple timeframes from 1-minute to 1-hour charts, and suitability for prop firm traders managing drawdowns and trade limits. pATR helps traders identify breakout zones, fade setups, and risk thresholds with precision.
Use cases cover breakout confirmation through volatility spikes, risk calibration by aligning stop-loss and position sizing with percentile volatility, and strategy backtesting using consistent volatility benchmarks. The indicator is designed for prop firm traders, scalpers, intraday strategists, quantitative traders integrating percentile logic, and educators focusing on volatility-aware execution.
Supported markets include Forex, stocks, indices, commodities, and cryptocurrencies, making pATR a versatile tool for various trading environments.
指标配置
客户评价
0.0
评价:0
客户评价
该产品尚无评价。已经试过了?抢先告诉其他人!
讨论
常见问答
Prop
Forex
Signal
Breakout
Indices
Commodities
Crypto
Stocks
ATR
cTrader Store 提供的所有产品,包括交易机器人、指标和插件,均由第三方开发者提供,仅供信息参考和技术访问之用。cTrader Store 并非经纪商,不提供投资建议、个人推荐或任何未来业绩保证。


猜您喜欢


!["[Stellar Strategies] Smart ADX" 标识](https://cdn.ctrader.com/image/webp/af13b084-b6f6-41db-b7bc-c7e688b57b05_36929)


价格
26
销售
2.17K
免费安装