
说明
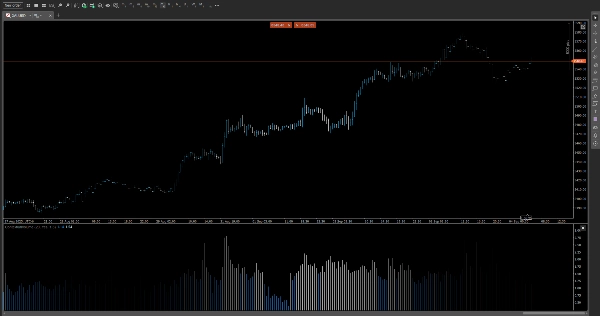
📊 相对成交量日内指标 (RVI)
捕捉重要的成交量激增——在关键时刻。
RVI 是一个精确设计的指标,将当前成交量与同一时间段的历史平均值进行比较,揭示日内交易时段中的隐含动量和流动性变化。
🔍 主要特点
• 按时间段的成交量分析
计算每个时间段(例如上午10:15)在之前交易时段中的平均成交量,为每根K线提供上下文基准。
• 多时间框架支持
无缝适用于5分钟图表至12小时时间框架,适应您的交易风格——剥头皮、波段或基于交易时段。
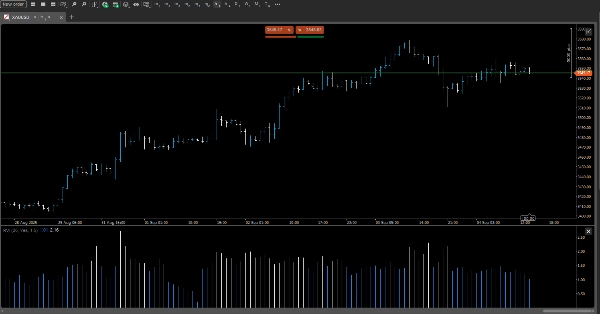
• 动态颜色编码
使用可自定义的颜色阈值突出显示成交量高于平均水平的K线。通过直观的视觉提示,瞬间识别高活跃区域。
• 比率与差值模式
选择您偏好的指标:
• 比率模式: 显示当前成交量 ÷ 平均成交量(例如,2.3×)
• 差值模式:显示绝对偏差(例如,+1,200 合约)
• 叠加或面板显示
在图表内叠加显示或紧凑的侧边面板之间切换,方便与您现有布局整洁集成。
🎯 使用场景
• 通过相对于典型活动的成交量激增确认突破力度
• 在低成交量期间过滤假信号
• 识别关键日内窗口期的机构足迹
• 利用时间感知的上下文增强基于成交量的策略
⚙️ 自定义选项
• 可调节的历史平均回溯周期
• 用户定义的成交量强度颜色阈值
• 切换显示模式(比率/差值)
• 兼容暗色/亮色主题
摘要
AI 摘要
The Relative Volume Intraday (RVI) indicator measures current trading volume against its historical average for the same time of day, highlighting significant volume surges during intraday sessions. It calculates average volume for specific time slots across past sessions, providing a contextual benchmark for each candle. RVI supports multiple timeframes, from 5-minute to 12-hour charts, accommodating various trading styles such as scalping, swing, or session-based trading. The indicator features dynamic color coding to visually emphasize candles with above-average volume based on customizable thresholds. Users can select between Ratio Mode, displaying the current volume as a multiple of the average, or Difference Mode, showing the absolute deviation in volume. Display options include overlaying the indicator directly on the price chart or presenting it in a separate panel for layout flexibility. Customization options allow adjustment of the lookback period for averaging, user-defined color thresholds, display mode toggling, and compatibility with dark or light themes. RVI is applicable for confirming breakout strength, filtering false signals during low-volume periods, identifying institutional activity during key intraday windows, and enhancing volume-based strategies with time-aware context. It is relevant for markets including forex, indices, commodities, cryptocurrencies, and proprietary trading environments.
指标配置
客户评价
5.0
评价:1
5 | 100 % | |
4 | 0 % | |
3 | 0 % | |
2 | 0 % | |
1 | 0 % |
客户评价
September 8, 2025
Spread and slippage need a line in the notes, and the journal looks less noisy.
讨论
常见问答
Prop
Forex
Breakout
Indices
Commodities
Crypto
cTrader Store 提供的所有产品,包括交易机器人、指标和插件,均由第三方开发者提供,仅供信息参考和技术访问之用。cTrader Store 并非经纪商,不提供投资建议、个人推荐或任何未来业绩保证。


价格
26
销售
2.17K
免费安装