
说明
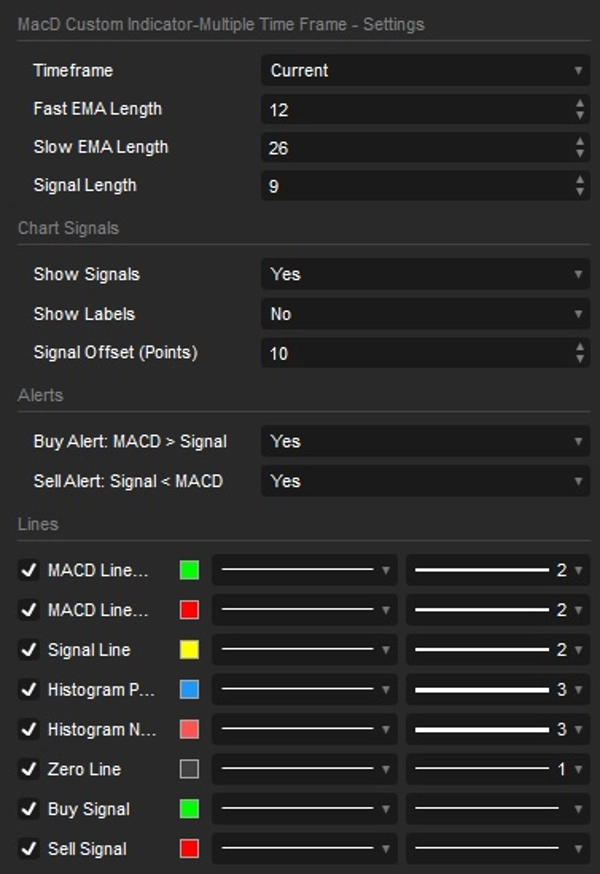
MACD 自定义多时间框架 (MTF) v1.1 是一款先进工具,将经典 MACD 的强大功能与多时间框架分析的关键优势及现代直观的可视化相融合。专为追求精准、快速解读及能够根据独特策略定制工具的精明交易者设计。
版本 1.1 新增内容:
- 100% 平滑视觉效果: 修复了断裂/不连续的 MACD 线——趋势变化期间线条现在完美连续。
- 更佳可见性: 增大了买入/卖出信号点的尺寸,加粗了信号线和柱状图,视图更加清晰。调暗了零线以减轻眼睛疲劳。
- 智能简化警报: 清理了设置窗口。只需切换“买入警报”或“卖出警报”,指标会自动处理屏幕弹窗和正确的声音通知。
- 有序设置: 所有参数现已美观地分组到直观类别中,用户体验大幅提升。
- 完整英文本地化: 所有日志消息、弹窗和错误均已完全本地化为英文。
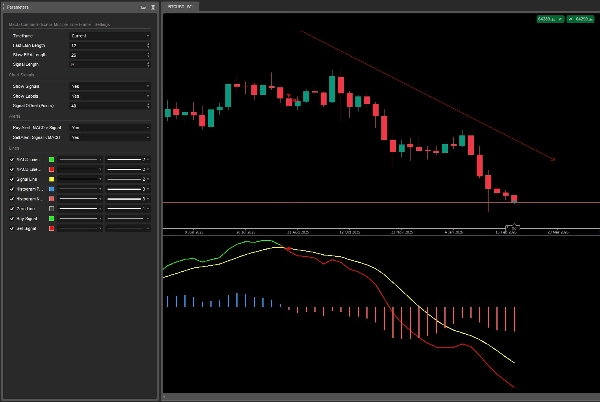
单图多时间框架 (MTF) 分析:
停止切换图表!直接在当前工作图表(如 M5、M15)上显示更高时间框架(如 H1、H4、D1)的 MACD 数据。获得宝贵的更广泛市场背景,识别主导的潜在趋势,有效过滤低时间框架的误导性噪音。完全可配置——可从分钟到月度的全面时间框架列表中选择。
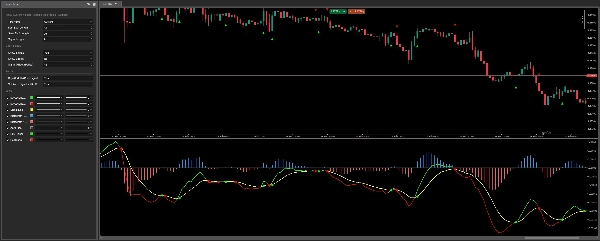
动态 MACD 与信号线着色:
即时趋势确认:MACD 线在穿越信号线时动态变色,生动展示看涨或看跌动能。不再猜测——线条颜色立即告诉您 MACD 是在信号线之上(看涨)还是之下(看跌)。
清晰的柱状图:
轻松可视化 MACD 与其信号线之间的背离(强度)。指标根据柱状图是正值(蓝色)还是负值(红色)直观地为加粗柱子着色,一目了然地提供动能变化的深刻洞察。
显著的视觉交叉信号:
再也不会错过关键交叉!指标自动高亮显示 MACD/信号线交叉。在价格图表上直接绘制明显且高度可见的点(带可调偏移),并提供可选的“买入”/“卖出”文字标签,确保极致清晰。
集成智能警报:
内置便捷的弹窗和声音通知功能,针对买入和卖出信号。无需盯着屏幕,也能及时获知每个机会!只需在设置中切换警报,指标将为您监控。
全面自定义尽在掌握:
- 根据您的精确需求定制快速 EMA、慢速 EMA 和信号线的长度。
- 所有设置整齐地组织成逻辑分组(MACD 设置、图表信号、警报),便于快速调整。
- 切换各个视觉元素的可见性:MACD 和信号线、柱状图、交叉信号及标签。
- 可调节的信号偏移,完美匹配您的图表美学和偏好。
摘要
AI 摘要
The MacD Custom Indicator Multi Time Frame is an advanced MACD-based tool designed for multi-timeframe analysis on a single chart. It allows traders to display MACD data from higher timeframes (e.g., H1, H4, D1) directly on lower timeframe charts (e.g., M5, M15), providing broader market context and helping to identify dominant trends while filtering out noise.
Key features include dynamic coloring of the MACD and signal lines to indicate bullish or bearish momentum, a crystal-clear histogram that visualizes the divergence between MACD and its signal line with color-coded bars, and unmistakable visual crossover signals marked by distinct dots or arrows on the price chart. The indicator supports integrated alerts with popup and sound notifications for buy and sell signals, configurable via a streamlined settings interface.
Users can fully customize the indicator by adjusting Fast EMA, Slow EMA, and Signal Line lengths, toggling visibility of visual elements (lines, histogram, signals, labels), and modifying colors and line thickness. The settings are organized into intuitive categories for ease of use. This indicator supports a wide range of timeframes from minutes to monthly and is suitable for various markets including Forex, indices, commodities, stocks, and cryptocurrencies.
指标配置
客户评价
5.0
评价:2
5 | 100 % | |
4 | 0 % | |
3 | 0 % | |
2 | 0 % | |
1 | 0 % |
客户评价
January 23, 2026
This is really good, with the histogram to guage the momentum, & signal (line) is very accurate in detecting trend changes, doesnt need much tweaking across time frames; very reliable indicator. - If the seller could include filtering sideways markets it would be a big help to reduce bad and false signals. -
November 4, 2025
The MACD MTF takes momentum analysis to the next level 🔍 - showing how different timeframes align or diverge. Spot strong trends when all layers agree and avoid traps when they clash. Clean visuals, flexible settings, and smooth performance make this a must-have for precision traders seeking multi-level confirmation.
讨论
常见问答
Signal
Indices
Commodities
GBPUSD
RSI
Bollinger
Fibonacci
Scalping
AI
XAUUSD
NAS100
MACD
BTCUSD
Forex
EURUSD
NZDUSD
Martingale
Prop
ZigZag
Supertrend
Fair Value Gap
SMC
Crypto
Grid
Stocks
ATR
USDJPY
VWAP
cTrader Store 提供的所有产品,包括交易机器人、指标和插件,均由第三方开发者提供,仅供信息参考和技术访问之用。cTrader Store 并非经纪商,不提供投资建议、个人推荐或任何未来业绩保证。


价格
85
销售
136
免费安装