
说明
确定多笔交易的平均成本价是困难的。设置止损和止盈也很困难,因为多笔交易的平均价格未知。
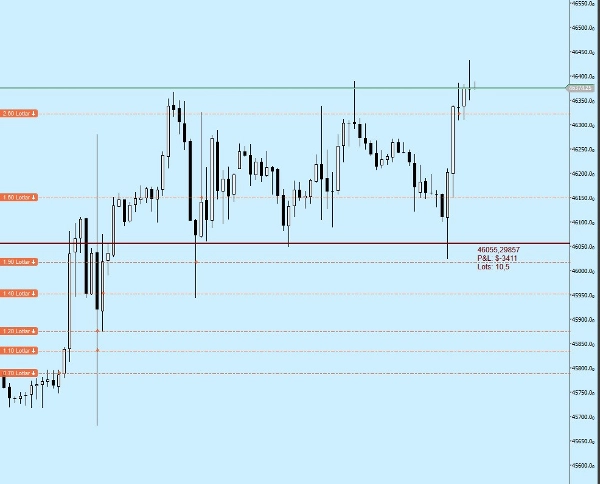
平均成本价指标为您提供:
* 平均买入或卖出价格线,
* 基于平均成本线的总利润或亏损金额,
* 总手数
摘要
AI 摘要
Average Cost Price is a trading indicator designed to help traders monitor their open positions directly on the chart. It calculates and displays the average buy or sell price line for multiple trades, simplifying the process of managing positions with varying entry prices. The indicator also shows the total profit or loss amount based on this average cost line, providing a clear overview of overall position performance. Additionally, it tracks the total lot quantity held. This tool supports various markets including Forex, Stocks, Commodities, Crypto, and Indices, and is applicable to symbols such as BTCUSD, EURUSD, GBPUSD, XAUUSD, and USDJPY. By consolidating multiple trade entries into a single average cost metric, it aids in setting more accurate Stop Loss and Take Profit levels.
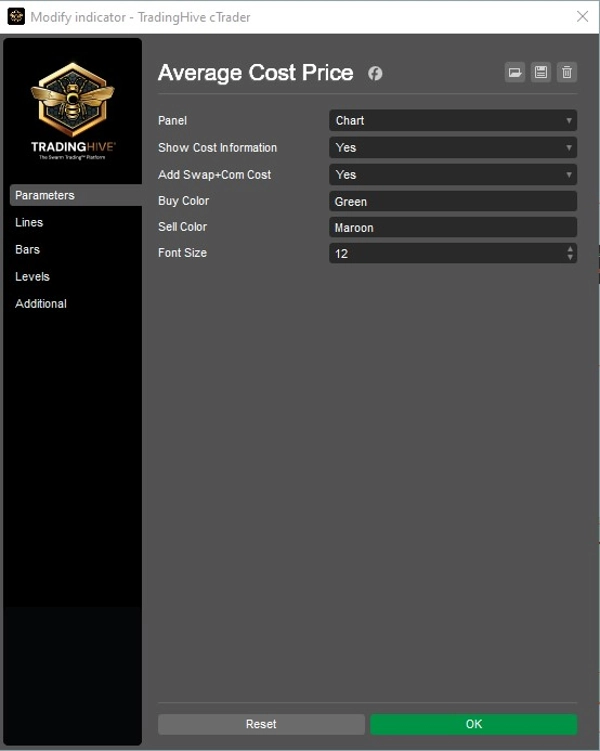
指标配置
客户评价
4.5
评价:2
5 | 50 % | |
4 | 50 % | |
3 | 0 % | |
2 | 0 % | |
1 | 0 % |
客户评价
October 3, 2025
ngl, trade control feels cleaner and that is enough to keep testing it. Win rate means less without average R.
October 1, 2025
The tool feels better once the workflow feels calmer, and spread and slippage need a line in the notes.
讨论
常见问答
BTCUSD
Prop
Forex
Indices
EURUSD
Commodities
GBPUSD
Crypto
Stocks
XAUUSD
USDJPY
cTrader Store 提供的所有产品,包括交易机器人、指标和插件,均由第三方开发者提供,仅供信息参考和技术访问之用。cTrader Store 并非经纪商,不提供投资建议、个人推荐或任何未来业绩保证。


价格
注册日期 01/09/2025
1
销售