Описание
Сессии от [BeyondTrading] — Узнайте, где был рынок.
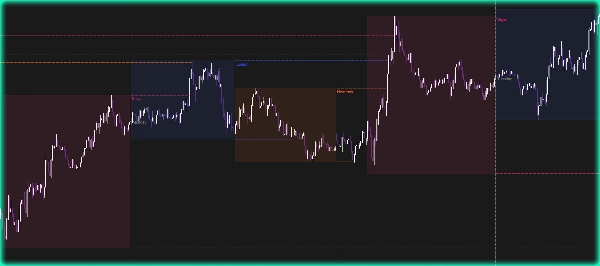
Визуализируйте 4 основные торговые сессии прямо на вашем графике — Нью-Йорк, Лондон, Токио, Сидней — полностью настраиваемые по цвету, времени и прозрачности. Каждая сессия рисует живую рамку диапазона, которая расширяется в реальном времени по мере движения цены, чтобы вы всегда знали формируемый диапазон.
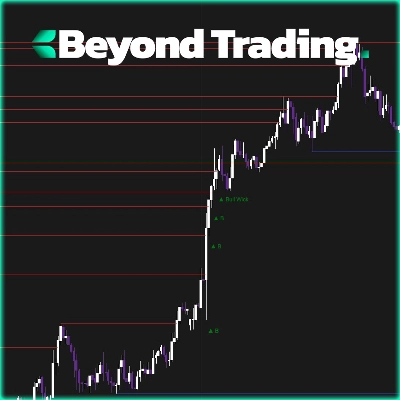
Когда сессия закрывается, максимум и минимум автоматически проецируются вперед в виде пунктирных линий. Эти уровни остаются активными, пока цена их не пробьет — затем они исчезают. Никакой путаницы, никаких догадок. Вы видите точно, какие уровни еще активны, а какие уже пробиты.
Почему важны уровни максимума/минимума сессии
Максимумы и минимумы сессий — это основные пулы ликвидности. Институты и маркетмейкеры постоянно возвращаются к этим уровням, чтобы либо развернуться, либо захватить ликвидность перед реальным движением. Предыдущий максимум Лондона — это не просто линия — это место, где находятся стоп-ордера, где застряли трейдеры на пробое и где умные деньги охотятся перед разворотом. С автоматическим расширением и мгновенным обнаружением пробоя вы всегда знаете, какие уровни еще в игре и могут вызвать реакцию.
Особенности
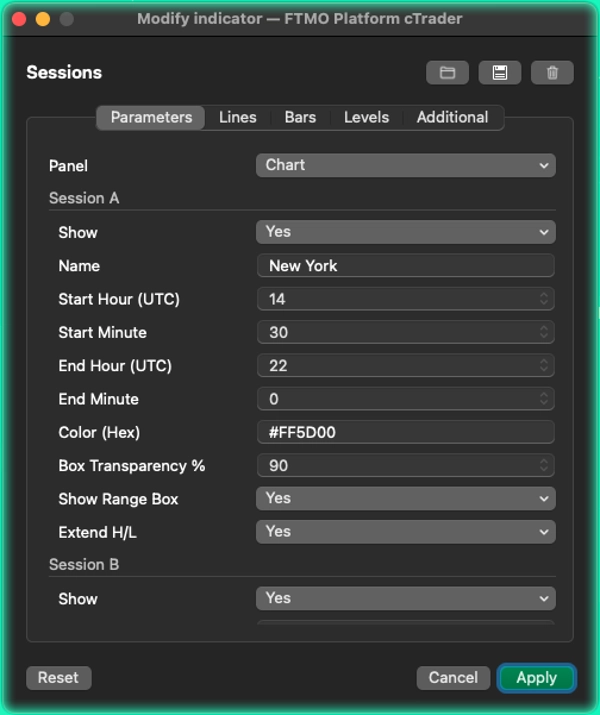
- 4 полностью настраиваемые сессии с пользовательским временем начала/окончания, шестнадцатеричным цветом и прозрачностью.
- Живая рамка диапазона, обновляющаяся на каждом баре.
- Максимум и минимум проецируются вперед после закрытия сессии, автоматически удаляются при пробое.
- Настраиваемое максимальное количество активных уровней для поддержания чистоты графика.
- Ежедневный вертикальный разделитель с меткой дня недели.
- Работает с ночными сессиями, такими как Сидней.
Сводка
After a session closes, the session's High and Low levels are automatically projected forward as dashed lines. These levels remain active until the price breaks through them, at which point they are removed, helping traders identify live breakout points without clutter. The indicator supports configurable maximum active levels to maintain chart clarity and includes a daily vertical divider labeled with the day of the week.
Designed to work with overnight sessions like Sydney, this tool highlights key liquidity zones where institutional traders often act. It is applicable across multiple markets including Forex, indices, commodities, cryptocurrencies, and stocks. The indicator aids in recognizing important breakout and reversal levels based on session highs and lows, facilitating informed trading decisions.
Обсуждение
Отзывы покупателей
5 | 100 % | |
4 | 0 % | |
3 | 0 % | |
2 | 0 % | |
1 | 0 % |