
Description
Découvrez les zones de trading à haute probabilité avec Advanced Supply Demand !
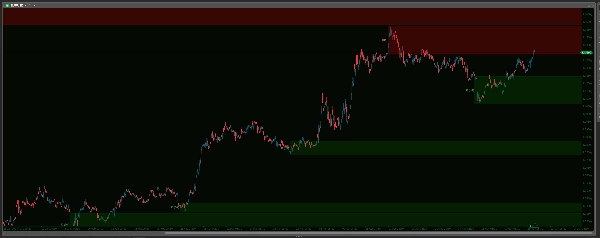
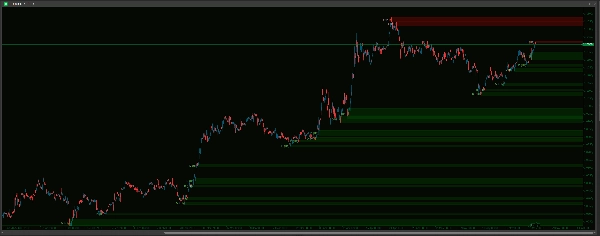
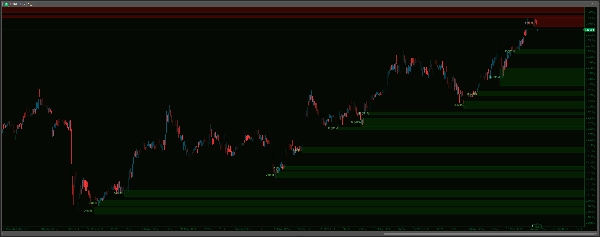
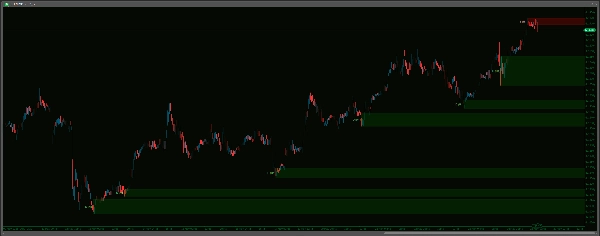
Obtenez une vue plus claire du marché avec l'indicateur Advanced Supply Demand Zones V2 . Cet outil puissant identifie et met automatiquement en évidence les zones cruciales d'offre et de demande sur votre graphique, pouvant potentiellement indiquer où des réactions de prix significatives peuvent se produire. Doté d'un algorithme sophistiqué de détection des points de retournement, de capacités multi-échelles temporelles (MTF) et d'options de personnalisation étendues, vous pouvez adapter parfaitement l'indicateur à votre style de trading. Gérez efficacement les zones avec des options pour supprimer les zones rompues ou coïncidentes, appliquer des limites de temps et garder votre graphique propre. Améliorez votre analyse avec des apparences de zones personnalisables, des étiquettes de période claires et un système d'alerte sonore robuste – complet avec un tampon de données en direct pour éviter le bruit historique – garantissant que vous êtes averti des approches clés des prix vers vos zones définies. Élevez votre analyse technique au niveau supérieur et prenez des décisions de trading plus éclairées !
-------------------
Améliorations par rapport à la V1 :
Advanced Supply Demand V2 offre des améliorations significatives pour une expérience de trading plus précise, conviviale et efficace :
- Alertes plus intelligentes et silencieuses – Fini le bruit historique !
-
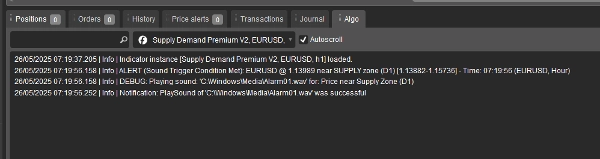
- Les alertes se déclenchent sur l'action des prix en temps réel après le chargement, éliminant les alertes historiques gênantes ! De plus, choisissez vos sons dans un menu déroulant, une grande amélioration par rapport à la saisie manuelle des noms de fichiers. Vous bénéficiez également de Max Alerts Per Zone pour éviter le spam de notifications.
- Configuration sans effort – Paramètres simplifiés !
-
- Profitez d'une configuration beaucoup plus intuitive avec des menus déroulants pour la plupart des options (Périodes, choix Oui/Non, styles de ligne, fichiers sonores). Faites-le bien du premier coup, à chaque fois !
- Logique et gestion des zones plus claires – Moins d'encombrement, plus de clarté !
-
- Rationalisé vers une approche plus directe et exploitable. La V2 utilise des règles claires pour supprimer les zones rompues, gère intelligemment les zones qui se chevauchent (coïncidentes) pour garder votre graphique propre, et propose une simple expiration basée sur le temps pour les anciennes zones, ainsi qu'une option pour limiter le nombre de zones affichées.
- Contrôle visuel supérieur – Votre graphique, à votre façon !
-
- Obtenez un contrôle granulaire avec des paramètres d'apparence séparés (couleur, épaisseur, style) pour les zones d'offre et de demande. Adaptez précisément les visuels à votre préférence et rendez les zones interactives sur votre graphique !
- Définition de zone plus flexible !
-
- Inclut désormais l'option
IncludeBarBody, vous permettant de choisir entre des zones uniquement sur les mèches ou des zones qui incorporent le corps de la bougie pour une perspective de marché potentiellement plus large et différente.
- Inclut désormais l'option
-------------------
Guide des paramètres : Advanced Supply Demand Zones
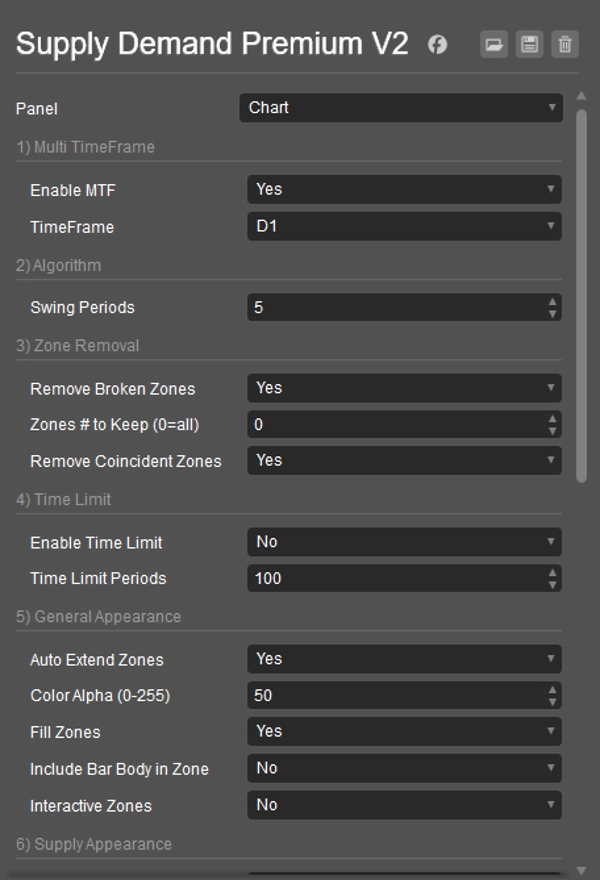
1) Multi TimeFrame
- Activer MTF : Oui pour voir les zones d'une autre période sur votre graphique actuel. Non pour les zones du graphique actuel.
- Période : Si MTF est Oui, choisissez ici l'autre période (par exemple, zones H4 sur un graphique M15).
2) Algorithme
- Périodes de Swing : Définit combien de barres définissent un retournement fort du marché (point de swing) pour créer des zones. Des nombres plus élevés signifient des zones plus fortes (et généralement moins nombreuses).
3) Suppression des zones
- Supprimer les zones rompues : Oui pour supprimer automatiquement les zones une fois que le prix les franchit clairement.
- Nombre de zones à conserver (0=toutes) : Limite le nombre des zones les plus récentes affichées.
0affiche toutes. - Supprimer les zones coïncidentes : Oui pour supprimer automatiquement la plus ancienne des deux zones si elles se chevauchent fortement, gardant le graphique plus propre.
4) Limite de temps
- Activer la limite de temps : Oui pour faire disparaître automatiquement les zones très anciennes.
- Périodes de limite de temps : Si la limite de temps est activée, les zones plus anciennes que ce nombre de barres seront supprimées.
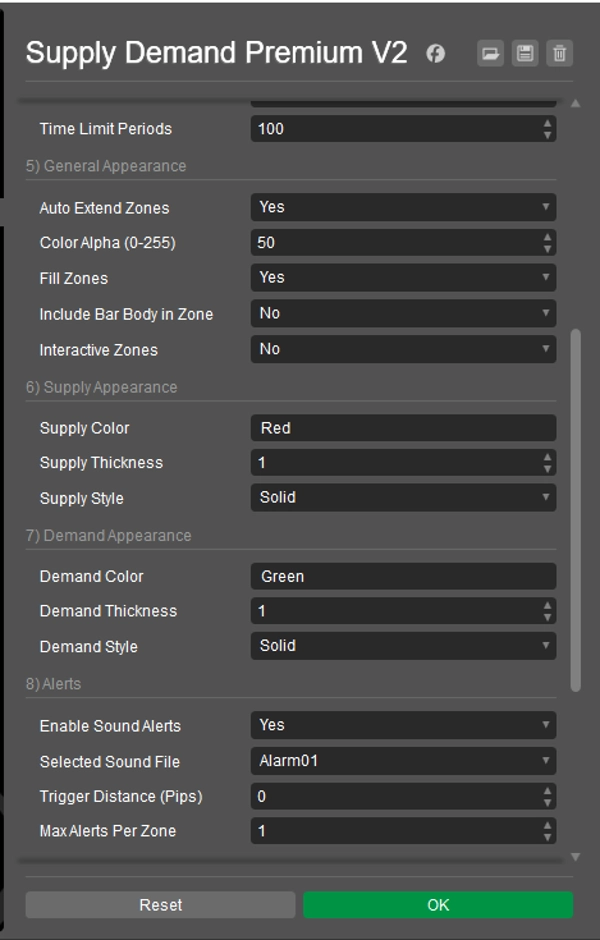
5) Apparence générale
- Extension automatique des zones : Oui pour dessiner les zones loin dans le futur. Non pour des zones plus courtes.
- Alpha de couleur (0-255) : Définit la transparence des couleurs des zones (0 = invisible, 255 = opaque).
- Remplir les zones : Oui pour remplir les zones avec de la couleur. Non pour seulement les contours.
- Inclure le corps de la barre dans la zone : Oui pour utiliser le corps de la bougie (plus les mèches) pour la largeur de la zone. Non pour utiliser uniquement les mèches.
- Zones interactives : Oui pour vous permettre de cliquer et déplacer les zones sur le graphique.
6) Apparence de l'offre
- Couleur de l'offre : Définit la couleur des zones d'offre (supérieures). (par exemple, "Rouge", "#FF0000")
- Épaisseur de l'offre : Définit l'épaisseur de la ligne de bordure des zones d'offre.
- Style de l'offre : Définit le style de la ligne de bordure (Solide, Points, etc.) pour les zones d'offre.
7) Apparence de la demande
- Couleur de la demande : Définit la couleur des zones de demande (inférieures). (par exemple, "Vert", "#00FF00")
- Épaisseur de la demande : Définit l'épaisseur de la ligne de bordure des zones de demande.
- Style de la demande : Définit le style de la ligne de bordure (Solide, Points, etc.) pour les zones de demande.
8) Alertes Remarque : Pour éviter les alertes sur les anciennes données ou au démarrage, les alertes sonores ne s'activeront qu'après 20 ticks de prix en direct depuis le chargement de l'indicateur sur votre graphique.
- Activer les alertes sonores : Oui pour activer les notifications sonores lorsque le prix approche d'une zone.
- Fichier sonore sélectionné : Choisissez le son que vous souhaitez entendre pour les alertes. Les sons système (comme "Alarm01") essaient de jouer depuis
C:\Windows\Media\; assurez-vous que le fichier existe et que cTrader peut y accéder. "cTraderDefaultAlert" utilise un son standard de cTrader. "None" ne joue aucun son. - Distance de déclenchement (pips) : À quelle proximité (en pips) le prix doit-il se trouver du bord d'une zone pour déclencher une alerte.
- Nombre maximum d'alertes par zone : Limite le nombre de fois qu'une alerte sonnera pour la même zone.
9) Étiquette de période
- Afficher l'étiquette de période : Oui pour afficher la période (par exemple, H1, D1) sur chaque zone.
- Couleur de l'étiquette d'offre : Couleur du texte pour les étiquettes des zones d'offre.
- Couleur de l'étiquette de demande : Couleur du texte pour les étiquettes des zones de demande.
- Décalage X de l'étiquette (barres) : Ajuste la position horizontale de l'étiquette par rapport au début de la zone.
- Taille de la police de l'étiquette : Définit la taille du texte de l'étiquette.
10) Autres
- Nettoyage au démarrage : Oui pour supprimer les anciens dessins de cet indicateur lorsque cTrader démarre ou que l'indicateur est ajouté à un graphique.
- Réidentifier les zones supprimées : (Ce paramètre a un impact direct limité dans la version actuelle. Les zones sont réévaluées à chaque tick ; si les critères pour une zone sont à nouveau remplis et qu'elle n'est pas considérée comme rompue, elle réapparaîtra indépendamment de ce paramètre Oui ou Non).
----------------------------
N'hésitez pas à consulter mes autres indicateurs :
https://ctrader.com/products/1181
https://ctrader.com/products/1182
https://ctrader.com/products/1180
https://ctrader.com/products/1015
https://ctrader.com/products/555
https://ctrader.com/products/553
https://ctrader.com/products/554
https://ctrader.com/products/552
https://ctrader.com/products/557
https://ctrader.com/products/845
https://ctrader.com/products/848
https://ctrader.com/products/847
https://ctrader.com/products/846
https://ctrader.com/products/551
https://ctrader.com/products/574
https://ctrader.com/products/573
https://ctrader.com/products/556
https://ctrader.com/products/558
https://ctrader.com/products/559
https://ctrader.com/products/560
Résumé
Visual customization is granular, with separate settings for supply and demand zone colors, thickness, and line styles. Zones can be configured to include candle wicks only or both wicks and bodies, providing flexible market perspectives. Interactive zones allow users to click and move zones directly on the chart.
The alert system is designed to minimize noise by triggering notifications only on live price action after the indicator loads, with configurable sound options and limits on alert frequency per zone. Timeframe labels can be displayed on zones with customizable appearance settings.
Additional features include automatic cleanup of old drawings on startup and options to re-identify zones dynamically. This indicator aims to enhance technical analysis by clearly marking high-probability trading zones for more informed decision-making.
Avis clients
5 | 0 % | |
4 | 100 % | |
3 | 0 % | |
2 | 0 % | |
1 | 0 % |


