
说明
展示:
Supertrend 指标 – 一个对交易者至关重要的工具,使您轻松跟随市场趋势并做出更明智的投资决策!这个直观的专业级指标旨在提供清晰的买入和卖出信号,无论您是刚入门还是经验丰富的投资者。
为什么选择 Supertrend 指标?
- 行业标准的准确性: 现在支持可自定义的ATR移动平均类型(包括Wilder平滑)。它的计算和反应方式完全与TradingView等顶级图表平台上最受欢迎的高级Supertrend版本相同!
- 100% 不重绘: 内置坚如磐石的趋势记忆机制。一旦趋势发生变化并打印信号,信号将保持不变。无重绘,无消失的箭头,浏览图表历史时无重新计算错误。
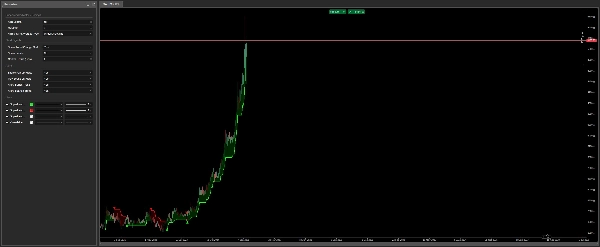
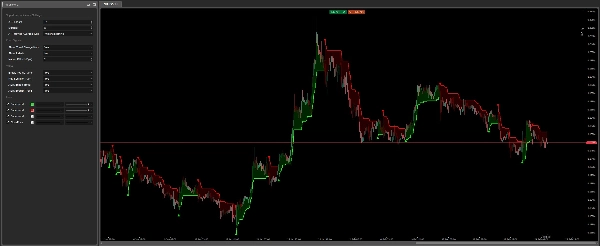
- 简洁且高效: 指标会自动绘制一条Supertrend线,当市场上涨时变为绿色(买入信号),下跌时变为红色(卖出信号)。您将始终准确知道趋势的方向。
- 智能实时通知: 绝不错过任何交易机会!该指标配备升级的警报系统,利用原生cTrader弹出窗口和集成音效。此外,内置防垃圾信息保护,实时信号发生时仅提醒一次——加载或重新加载图表时不会有烦人的声音垃圾信息。
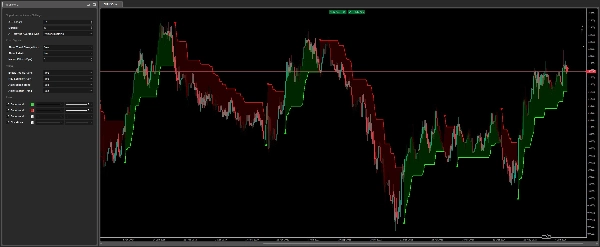
- 增强的视觉信号和云填充: 在每个关键趋势变化时,您会看到醒目的箭头和可选的“看涨”/“看跌”文字标签。Supertrend线与价格之间的细腻动态云填充帮助您一目了然地把握市场动能。
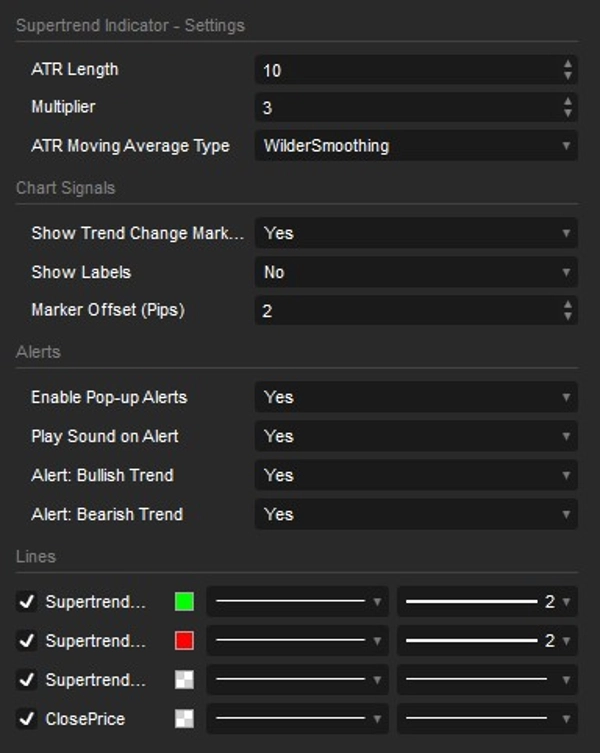
- 完全可定制且精准: 轻松调整核心设置,如ATR长度和乘数。您还可以使用动态基点偏移精确控制箭头和标签的距离,确保任何资产上视觉效果完美且不杂乱。
Supertrend 指标 非常适合任何希望简化市场分析的人——从寻求轻松识别趋势的新手交易者,到希望为其策略获得高度精准、不重绘信号的资深专业人士。它在任何市场上均能完美运行——外汇、股票、指数、加密货币——并适用于所有时间框架。
摘要
AI 摘要
The Supertrend Indicator v1.1 is a professional-grade trading tool designed to identify market trends and provide clear buy and sell signals. It features customizable ATR moving average types, including Wilder's smoothing, ensuring accuracy comparable to leading platforms. The indicator is 100% non-repainting, maintaining stable signals without recalculation errors or disappearing markers. It visually represents trends with a line that turns green during upward movements and red during downward trends, complemented by arrows, optional "Bullish"/"Bearish" labels, and a dynamic cloud fill to highlight market momentum. Real-time alerts use native cTrader pop-ups and sound effects with built-in spam protection, notifying users once per signal. Users can adjust key parameters such as ATR length, multiplier, and visual offsets for precise, uncluttered display across all asset types. The Supertrend Indicator supports multiple markets including Forex, Stocks, Indices, and Cryptocurrencies, and is suitable for all timeframes. It is designed for traders of all experience levels seeking a reliable, easy-to-interpret trend analysis tool.
指标配置
客户评价
4.3
评价:3
5 | 33 % | |
4 | 67 % | |
3 | 0 % | |
2 | 0 % | |
1 | 0 % |
客户评价
November 4, 2025
Smooth and steady - Supertrend v1.1 keeps you riding the trend with confidence. Clear color switches show when momentum flips, helping you enter early and exit smart. Fast, reliable, and a classic trend tool that belongs in every trader’s arsenal. Pairs perfectly with momentum filters or ATR-based setups for precision entries!
August 6, 2025
讨论
常见问答
Signal
Indices
Commodities
GBPUSD
RSI
Bollinger
Fibonacci
Scalping
AI
XAUUSD
NAS100
MACD
BTCUSD
Forex
Breakout
EURUSD
NZDUSD
Martingale
Prop
ZigZag
Supertrend
Fair Value Gap
SMC
Crypto
Grid
Stocks
ATR
USDJPY
VWAP
cTrader Store 提供的所有产品,包括交易机器人、指标和插件,均由第三方开发者提供,仅供信息参考和技术访问之用。cTrader Store 并非经纪商,不提供投资建议、个人推荐或任何未来业绩保证。


价格
88
销售
149
免费安装