
说明
Market Cipher A 是一个高级技术指标,旨在轻松分析、识别和预测加密货币市场的宏观趋势。
结构与组成
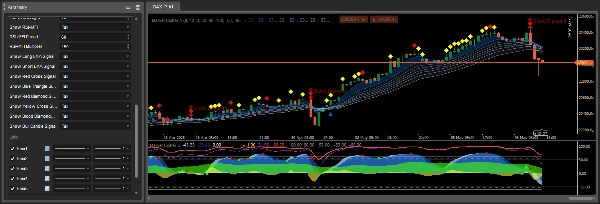
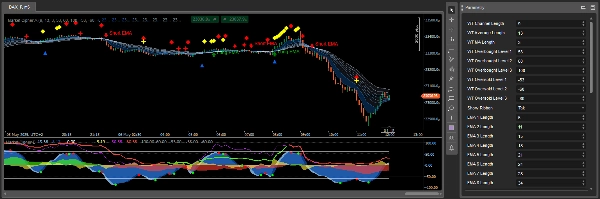
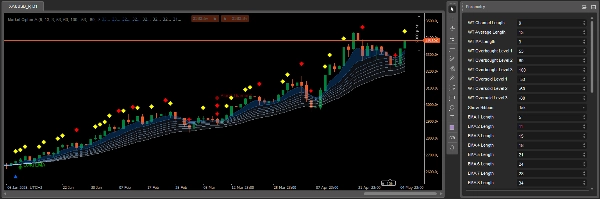
Market Cipher A 由一条包含 8 条指数移动平均线(EMA)的带状图组成,颜色会根据市场趋势变化。在牛市期间,EMA 带呈现蓝色或白色,在熊市期间呈现灰色。
默认情况下,使用 EMA 值从 5 到 34 的移动平均线。这些线的交叉可能是非常强的滞后指标,因此 Market Cipher A 被编程为自动显示对应不同信号的符号,消除了手动解读每个看涨或看跌交叉的需要。
符号与交易信号
Market Cipher A 直接在蜡烛图上显示特征符号,指示潜在的交易机会:
蓝色三角形 - 趋势反转信号,表示动能减弱和即将反转。这是趋势动能减弱的早期警告。
绿色圆圈 - 看涨指标,在 6 小时及以上时间框架中最可靠。通常出现在蓝色三角形之后,应在 1-3 根蜡烛内解读。
黄色菱形 - 表示上升趋势的延续。应与 EMA 带一起使用,以更好地确认趋势方向。
红色菱形 - 信号趋势减弱及可能的向下延续。表示下行动能增强。
红色 X - 看跌指标,在 1 小时及以上时间框架中最有效。应与 EMA 带和红色菱形一起使用。
黄色 X - 表示市场操纵,特别是大额多头仓位的快速买入和空头仓位的卖出。
大红菱形(血钻) - 最看跌的信号,表示高概率下跌,尤其是在与红色 X 或较小红色菱形同时出现时。
使用原则
Market Cipher A 通过视觉方式提供强大的数学支撑或阻力,便于理解交易环境。它在 Heiken Ashi 蜡烛图上效果最佳。
EMA 带不仅指示趋势,还作为动态支撑和阻力水平。当带为蓝色/白色且蜡烛位于其上方时,可以寻找做多机会。当带为灰色且蜡烛位于其下方时,可以考虑做空。
当 Market Cipher A 的信号与 Market Cipher 套件中的其他指标,特别是提供额外动能信号和入场点的 Market Cipher B 结合使用时,效果最佳。
趋势背景下的详细信号解读
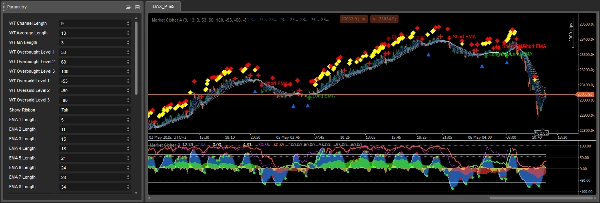
Market Cipher A 的一个重要方面是根据信号所处的主导趋势进行上下文解读。当带色从灰色变为蓝色时,指标会生成绿色圆圈,作为上升趋势开始的信号。通常,在绿色圆圈之后,如果接下来的 1-3 根蜡烛显示黄色菱形,突破的概率较高。但如果出现红色菱形,突破的可能性较低。
在牛市中,黄色菱形是有利的,显示与趋势一致的上升延续,而红色菱形表示逆势走势。在熊市中情况相反——红色菱形作为下跌延续是有利的,黄色菱形则表示与趋势相反的暂时上升。
红色 X 在出现在红色菱形之后且 EMA 带几乎完全收紧、变为看跌灰色时最可靠。该指标的准确性取决于时间框架。
运行机制与信号生成
Market Cipher A 中的符号和信号基于多个来源生成:WaveTrend 波浪交叉、超买超卖水平,以及 RSI 和 MFI 在穿越中心线或达到超买超卖条件时。这种多维分析使信号比单一指标更全面。
EMA 带由 8 条移动平均线组成,形成具有各带间分离特征的带状图。带间分离是一个重要因素——宽分离表示强趋势,收紧则暗示动能减弱或盘整。
交易策略中的实际应用
Market Cipher A 主要设计为趋势分析工具,因此在趋势跟随策略中效果最佳。建议将带与其他趋势识别指标一起使用,然后在价格回调时寻找交易机会。
重要的是要记住,这些信号有助于微调进出场时机,但不应单独用于做出交易决策。特别是在盘整行情中出现的反转信号,需要额外确认。
摘要
The indicator automatically displays distinct symbols on the price chart to signal potential trading opportunities:
- Blue Triangle: signals declining momentum and possible trend reversal.
- Green Circle: indicates a bullish trend start, most reliable on 6-hour timeframes and above.
- Yellow Diamonds: suggest continuation of an upward trend.
- Red Diamonds: indicate trend weakening and potential downward continuation.
- Red X: bearish signal effective on 1-hour timeframes and higher.
- Yellow X: points to market manipulation events.
- Large Red Diamond ("Blood Diamond"): strong bearish signal with high probability of decline.
Signals are generated using a combination of WaveTrend crossovers, RSI, and MFI indicators, providing multidimensional market analysis. Market Cipher A is optimized for use with Heiken Ashi candles and is best applied within trend-following strategies, ideally combined with other Market Cipher indicators for enhanced entry and momentum confirmation.
客户评价
5 | 67 % | |
4 | 33 % | |
3 | 0 % | |
2 | 0 % | |
1 | 0 % |


