
설명
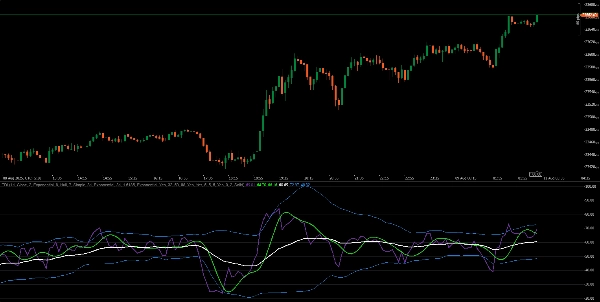
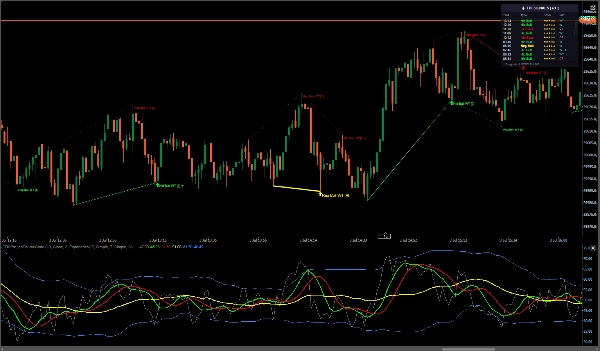
전문적인 TDI - RSI, 이동평균 평활화, 볼린저 밴드를 결합하고 자동 정규 및 숨겨진 다이버전스 감지를 제공합니다. TDI 창과 (선택적으로) 가격 차트에 다이버전스 라인을 그려 명확한 컨텍스트를 제공합니다.
다이버전스 엔진은 실시간 바를 건너뛰고 완전한 확인 후에만 피벗을 검증합니다. 시장 상태 필터링은 횡보 구간에서 저품질 신호를 억제하며, 강도 점수는 볼린저 밴드 극단, 추세 정렬, 시장 기준선 기울기, 피벗 품질, TDI 교차 근접성 등 여러 합류 요소를 사용해 모든 설정을 순위 매깁니다.
- 전체 TDI 세트: 가격선(녹색), 신호선(빨간색), 시장 기준선(노란색), RSI 밴드.
- 변동성 밴드: RSI에 적용된 볼린저 밴드(기간 및 편차 조정 가능).
- 다이버전스 엔진: 정규(반전) 및 숨겨진(추세 지속) 다이버전스를 감지합니다.
- 차트 내 시각화: 다이버전스 라인/레이블을 직접 가격 차트에 그리는 토글 기능.
- 정밀 피벗: 사용자 제어 스윙 피벗(좌/우 바) + 최소 바 간격.
주요 기능
- 리페인트 없는 구조
- 시장 상태 필터
- 볼린저 밴드 합류 ★
- 강도 점수 (1–5)
- 시각적 신호 우선순위
- 추세 정렬 (WT / CT)
변경 로그
- v1.0 – 초기 릴리스: 전체 TDI + 정규/숨겨진 다이버전스 감지, 차트 내 그리기, 가이드 레벨, 풍부한 스타일 제어.
내 다른 제품들
- Institutional FVG Zones MTF with Confluence
- All-in-One Session Levels Suite
- MARKET_STRUCTURE BOS_CHoCH
- Multi_TF Candlestick Chart Overlay
- ICT Killzones & Macros
- ICT_SMC_ToolKit
- VWAP_MTF
- Traders Dynamic Index (TDI)
- Market_Session_Forex
면책 조항: 거래에는 위험이 따르며 과거 결과가 미래 성과를 보장하지 않습니다. 적절한 위험 관리를 사용하고, 손절매 수준을 준수하며, 책임감 있게 거래하십시오. 이 알고리즘 사용으로 인한 재정적 손실에 대해 저는 책임지지 않습니다. 이 지표들을 합류 신호로 사용하여 차트 마크업 시간을 줄이십시오.
요약
AI 요약
TDI_Pro is a professional Traders Dynamic Index (TDI) indicator that integrates RSI, moving-average smoothing, and Bollinger Bands applied to RSI for volatility measurement. It features an automatic divergence detection engine that identifies both Regular (reversal) and Hidden (trend-continuation) divergences, drawing divergence lines in the TDI pane and optionally on the price chart for enhanced visual context.
The indicator employs a no-repaint architecture and validates swing pivots only after full confirmation, skipping live bars to ensure signal reliability. It includes a Market State Filter to suppress low-quality signals during ranging markets and a Strength Scoring system (1–5) that ranks setups based on multiple confluence factors such as Bollinger Band extremes, trend alignment, Market Base Line slope, pivot quality, and proximity of TDI crosses.
Key components of the full TDI suite include the Price Line (green), Signal Line (red), Market Base Line (yellow), and RSI bands. Users can control precision pivots with adjustable swing pivot parameters and minimum bar spacing. Visual signal priority and trend alignment features support clearer interpretation of market conditions. The indicator supports multiple symbols including BTCUSD, EURUSD, and GBPUSD, and is designed for use with bar and tick data.
지표 프로필
지표 카테고리
모멘텀
출력 유형
신호
시각화
필터
데이터 요구 사항
막대만
틱 데이터
지원되는 신호
크로스
다이버전스
돌파
변동성
고객 리뷰
4.3
리뷰: 3
5 | 67 % | |
4 | 0 % | |
3 | 33 % | |
2 | 0 % | |
1 | 0 % |
고객 리뷰
August 13, 2025
Practical add on for a more controlled workflow. It helps with checking stretched conditions before entries, but strong trends can keep signals stretched. RSI style levels around 30 and 70 help, but I would add a 2 swing divergence check. I would still keep manual review in the process.
August 12, 2025
August 12, 2025
Clean idea for traders around oscillator setups. The useful part is checking stretched conditions before entries, with the numbers checked before scaling. A clean test needs 25 oscillator signals, 2 timeframe confirmation and a clear 1R exit plan. The tool is useful when overbought or oversold is treated as context, not a command.
상담
자주 묻는 질문(FAQ)
BTCUSD
Bollinger Bands
EURUSD
GBPUSD
Key Levels
RSI
Support & Resistance
트레이딩 봇, 지표, 플러그인 등 cTrader Store에서 제공되는 상품은 제3자 개발자에 의해 제공되며, 이는 단순히 정보 및 기술적 접근을 목적으로 제공된 것입니다. cTrader Store는 중개인이 아니며, 투자 조언, 개인별 추천 또는 향후 성과에 대한 어떠한 보장도 제공하지 않습니다.
이 작성자의 상품 더 보기


가격
가입일 22/06/2025
81
판매
86
무료 설치