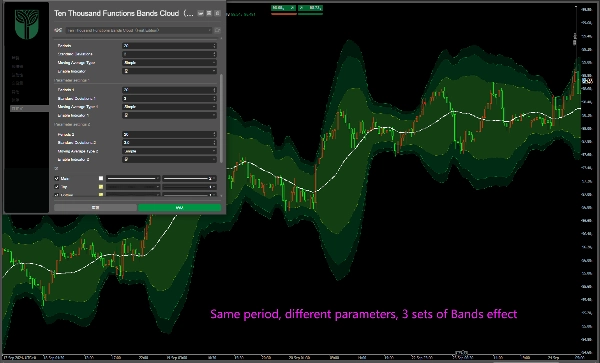
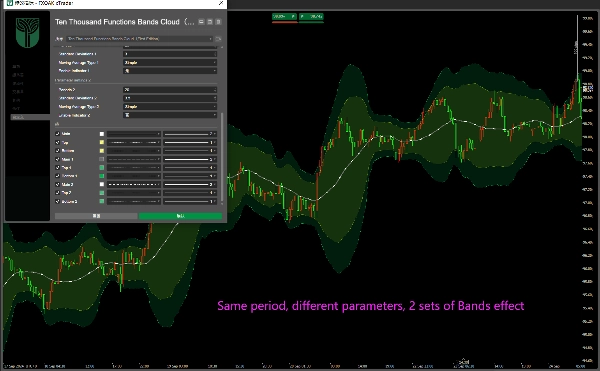
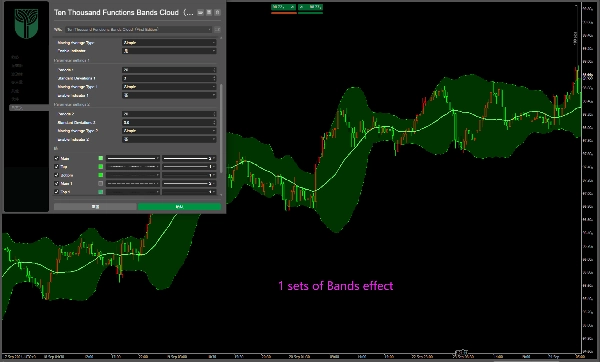
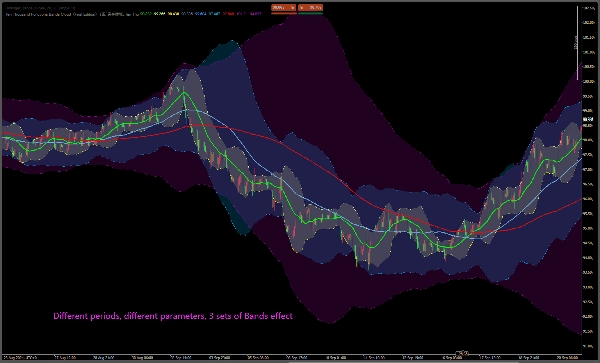
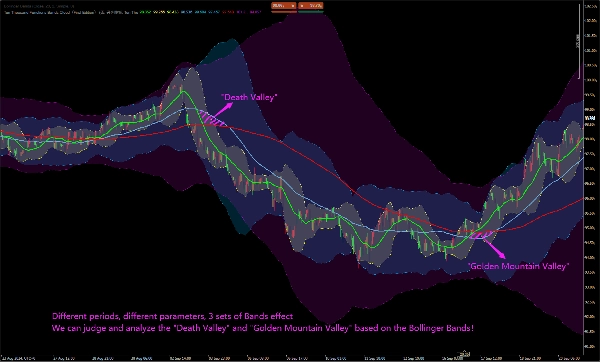
지표
NAS100
RSI
NZDUSD
XAUUSD
FVG
Fibonacci
EURUSD
MACD
Bollinger
GBPUSD
BTCUSD
VWAP
ZigZag
ATR
Supertrend
USDJPY
Ten Thousand Functions Bands Cloud(First Edition)
"Ten Thousand Functions Bands Cloud(First Edition)" 로고
17/10/2025
1
Desktop
"Ten Thousand Functions Bands Cloud(First Edition)" 업로드된 이미지"Ten Thousand Functions Bands Cloud(First Edition)" 업로드된 이미지"Ten Thousand Functions Bands Cloud(First Edition)" 업로드된 이미지"Ten Thousand Functions Bands Cloud(First Edition)" 업로드된 이미지"Ten Thousand Functions Bands Cloud(First Edition)" 업로드된 이미지

Regular 3 groups of bands:

period:20

Deviations:2.0;3.0; 3.5;

Empowered with cloud background!


You can close or open any one or two groups; And different parameters can be modified and set!


It can also be modified to other values, such as 2.0:20, 60, 144Bands;

Bands' mid track is equal to the moving average, which is the 20, 60, and 144 moving averages!


We can judge and analyze the "Death Valley" and "Golden Mountain Valley" based on the middle track of the Bollinger Bands!


常规3组Bands:

周期:20

偏差:2.0;3.0; 3.5;

支持云背景!

您可以关闭或打开任意一个或两个组;并且可以修改和设置不同的参数!

它也可以修改为其他值,如2.0:20、60、144布林带;

Bands中轨等于移动平均线,即20、60和144移动平均线!

我们可以根据布林中轨迹来判断和分析“死亡谷”和“金山谷”等......


標準3グループボリンジャーバンド(Bands):期間:20;偏差値:2.0;3.0;3.5;クラウドバックグラウンドに対応!任意の1グループまたは2グループをオン/オフ設定することが可能です。また、各パラメーターの修正と設定も行えます。他の数値に変更することも可能です。例えば2.0の偏差値で、期間20、60、144のボリンジャーバンドに設定するなど。ボリンジャーバンドの中線は移動平均線に等しく、すなわち期間20、60、144の移動平均線です。ボリンジャーバンドの中線に基づいて、「デッドバレー(死亡谷)」や「ゴールドバレー(金山谷)」などを判断・分析することができます。


Стандартные 3 группы Бандов (Полос Боллинджера): Период: 20; Отклонение: 2,0; 3,0; 3,5; Поддержка облачного фона! Вы можете отключить или включить любую одну или две группы; кроме того, вы можете изменять и настраивать различные параметры! Его также можно изменить на другие значения, например, Боллинджеры с отклонением 2,0 и периодами 20, 60, 144; Средняя линия Бандов равна скользящей средней, то есть скользящим средним с периодами 20, 60 и 144! Мы можем определять и анализировать такие явления, как «Мёртвая долина» и «Золотая долина», на основе средней линии 。


0.0
리뷰: 0
고객 리뷰
이 상품에 대한 리뷰가 아직 없습니다. 이미 사용해 보셨나요? 다른 사람들에게 가장 먼저 소개해 주세요!
이 작성자의 상품 더 보기
Zigzag T3
Three ZigZag lines
zh-cn Variety Period clock panel(multilanguage)
This indicator can be used to: change color, shape size, position, change font, increase or decrease, and other function
지표
VWAP
ZigZag
RSI
+6
RSI T3 overbought and oversold area
zh-cn Variety Period time panel(multilanguage)
This indicator can be used to: change color, shape size, position, change font, increase or decrease, and other function
지표
ZigZag
VWAP
RSI
+6
RSI T3 Overbought and oversold areas
Three parameter RSI
좋아하실 만한 다른 항목
Indicatore livelli numeri tondi_fabio23.traders
Indicatore dei livelli numeri tondi sul grafico , regolabile.Indicator of levels round numbers on the graph, adjustable
지표
VWAP
VWAP-Free
VWAP only timeframe
BWMFI_Visual
BW_MFI Vizual colors bars
지표
NAS100
Indices
NZDUSD
+9
MultiTimeFrame MovingAverage MTF MA
MultiTimeframe MA
지표
Forex
Market Sessions V2_NSC
Market Session V2: Full Control. colors, history, session/text toggles, font size. Elevate your strategy!
Support Resistance Zones
Support and Resistance.
지표
VWAP
RSI
XAUUSD
+9
Turtle Soup ICT Strategy
Turtle Soup ICT Strategy – Detect liquidity traps & trade smart money moves with precision on cTrader.
지표
Indices
RSI
Stocks
+5
REDGREENZONEREVERSAL
The Red & Green Zone Reversal Indicator detects overbought and oversold market conditions using Bollinger Bands and RSI.
지표
RSI
Breakout
XAUUSD
+4
Multi-Level Candle Bias Tracker
Price direction by calculating the probability of reaching new highs/lows. Shows levels & stats📈
FVG
The Indicator is a powerful tool for price-action traders seeking to identify and exploit short-term imbalances.
지표
Indices
Prop
Commodities
+3
PivotLevels
It draws Pivot Levels on the chart.
지표
Breakout
ORB v1.1
Opening Range Breakout v1.1 - Visuals + Stats
지표
NAS100
NZDUSD
Breakout
+13
AO_ZeroCross
Awesome Oscillator with instant zero-line cross alerts. Includes chart popup + sound notification
무료
지표
Indices
RSI
Signal
Rsi + Volume
This indicator combines RSI (Relative Strength Index) with volume analysis to generate more reliable trading signals.
지표
NAS100
XAUUSD
Commodities
+11
WHT AIRRA
Indicator that auto-calculates SL/TP via volatility. 3 layers: digital filtering, recursive Bayes, adaptive factor
Fisher_m11
Fisher Transform with smoothing. Spot reversals and cycles with precision. Great for any market, any timeframe.
지표
NZDUSD
Forex
USDJPY
+1
8 Currencies_NSC
RCS: 8 majors! AUD,USD,EUR,JPY,GBP,CAD,CHF,NZD. Find how strong each currency is relatively and trade smarter!
지표
NAS100
NZDUSD
XAUUSD
+13
WT - Hawkes Process
Identifies market compression zones and explosive Breakout moments using mathematical modeling.