
CCI - With Arrows and 40 80 EMA Logic_noSourceCode
지표
2 구매
버전 1.0, Feb 2025
Windows, Mac
5.0
리뷰: 1
설명
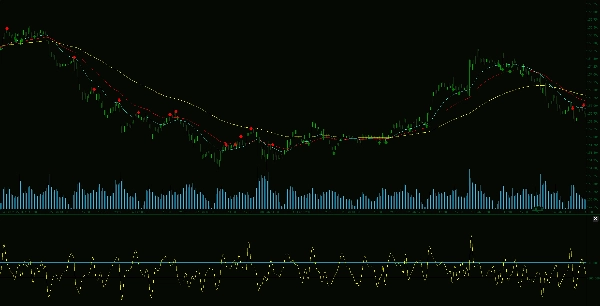
The Advanced CCI & EMA Indicator는 Commodity Channel Index (CCI)와 40 및 80 EMA 논리를 결합하여 추세 분석을 향상시키는 강력한 거래 도구입니다. 이 정교한 접근법은 잠재적인 가격 움직임을 나타내는 화살표를 생성하여 거래자가 높은 확률의 거래 기회를 식별하는 데 도움을 줍니다.
주요 특징:
요약
AI 요약
The Advanced CCI & EMA Indicator integrates the Commodity Channel Index (CCI) with 40 and 80-period Exponential Moving Averages (EMAs) to enhance trend analysis and momentum detection. It generates clear buy and sell arrows on the chart, signaling potential price movements based on combined momentum and trend confirmation. Key features include CCI-based identification of overbought and oversold conditions, EMA logic to confirm trend direction and filter weak signals, and customizable settings to adapt to various trading strategies and timeframes. This indicator supports traders in aligning with prevailing market trends and improving timing by reducing false reversal signals. It is suitable for use on indices and commodities markets.
지표 프로필
고객 리뷰
5.0
리뷰: 1
5 | 100 % | |
4 | 0 % | |
3 | 0 % | |
2 | 0 % | |
1 | 0 % |
고객 리뷰
February 25, 2025
half size is enough at the start. Low quality setups lose some appeal.
상담
자주 묻는 질문(FAQ)
Indices
Commodities
트레이딩 봇, 지표, 플러그인 등 cTrader Store에서 제공되는 상품은 제3자 개발자에 의해 제공되며, 이는 단순히 정보 및 기술적 접근을 목적으로 제공된 것입니다. cTrader Store는 중개인이 아니며, 투자 조언, 개인별 추천 또는 향후 성과에 대한 어떠한 보장도 제공하지 않습니다.
이 작성자의 상품 더 보기


가격
가입일 14/01/2025
55
판매
11.49K
무료 설치