
Supply Demand - BasicV1
Chỉ báo
1.27K lượt tải
Phiên bản 1.0, Feb 2025
Windows, Mac
5.0
Đánh giá: 3
Mô tả
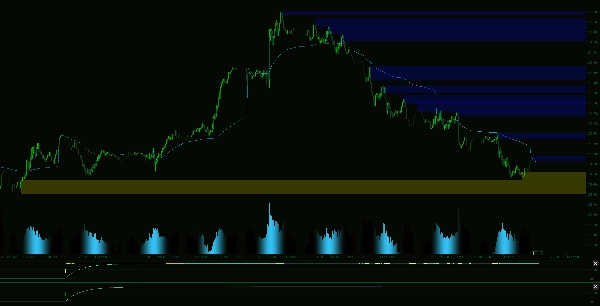
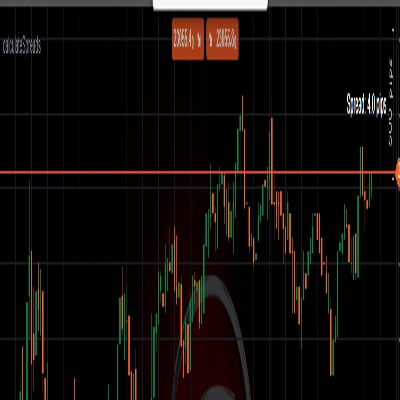
Xác định các vùng giao dịch có xác suất cao một cách chính xác
Chán ngấy việc vẽ thủ công các vùng cung và cầu? Chỉ báo nâng cao này sẽ làm tất cả công việc cho bạn, xác định các khu vực thị trường chính nơi giá có khả năng đảo chiều hoặc tích lũy. Được thiết kế cho các nhà giao dịch nghiêm túc, công cụ này giúp bạn giao dịch tự tin bằng cách làm nổi bật các vùng liên quan nhất theo thời gian thực.
Các tính năng chính:
Tóm tắt
Tóm tắt AI
Supply Demand - BasicV1 is an advanced trading indicator designed to automatically identify key supply and demand zones on a single chart timeframe. It highlights high-probability market areas where price is likely to reverse or consolidate, assisting traders in making informed decisions without manual zone drawing. The indicator features automatic detection of strong buy and sell zones, removal of fully broken zones to maintain chart clarity, and filtering of overlapping zones by eliminating weaker ones. Users can also set zones to expire after a specified number of bars, ensuring focus on the most relevant price levels. Additionally, the tool offers customizable visual settings, including zone colors, line styles, thickness, and opacity, allowing integration with various chart styles. This indicator operates in real-time, providing continuous updates to support precise market analysis.
Hồ sơ chỉ báo
Đánh giá của khách hàng
5.0
Đánh giá: 3
5 | 100 % | |
4 | 0 % | |
3 | 0 % | |
2 | 0 % | |
1 | 0 % |
Đánh giá của khách hàng
September 4, 2025
July 14, 2025
Pros: Clearly marks supply and demand zones. Customizable sensitivity and visual settings. Stable and light on resources. Cons: No alerts or tooltips. Lacks volume-based filtering and setting templates. Needs confirmation for trade signals.
May 6, 2025
Buen Indicador, Marca Zonas importantes ,, facilita la visualizacion y evita la marcacion manual por fallo del operador discrecional
Thảo luận
Câu hỏi thường gặp
Các sản phẩm có sẵn trên cTrader Store, bao gồm bot giao dịch, chỉ báo và plugin, được cung cấp bởi các nhà phát triển bên thứ ba và chỉ nhằm mục đích cung cấp thông tin và tiếp cận kỹ thuật. cTrader Store không phải là nhà môi giới và không cung cấp lời khuyên đầu tư, khuyến nghị cá nhân hay bất kỳ đảm bảo nào về hiệu suất trong tương lai.


![Logo "[Hamster-Coder] Moving Average MTF"](https://cdn.ctrader.com/image/webp/b11b98b1-194d-4b8e-b00e-d611826ad159_31226)


Giá
Kể từ 14/01/2025
55
Lượt bán
11.36K
Cài đặt miễn phí