present
Daftar dan dapatkan diskon $50 untuk pembelian pertama Anda
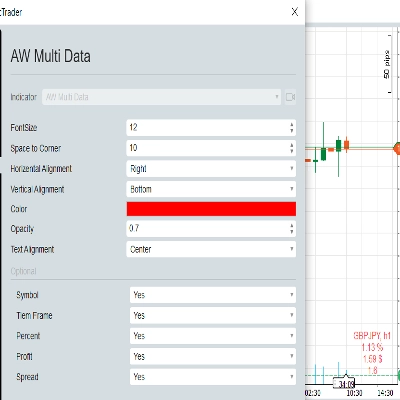
Trading product for IR Spread Indikator, image 1
IR Spread
5.0
Ulasan: 2
5.63K
Instal gratis

Deskripsi

tampilkan spread saat pembaruan grafik

Telegram Channel dukung kami untuk lebih banyak indikator dan bot gratis

Ringkasan

Ringkasan AI
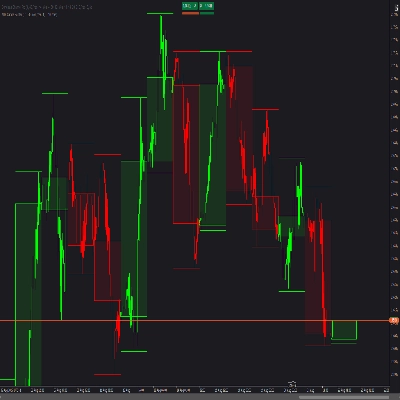
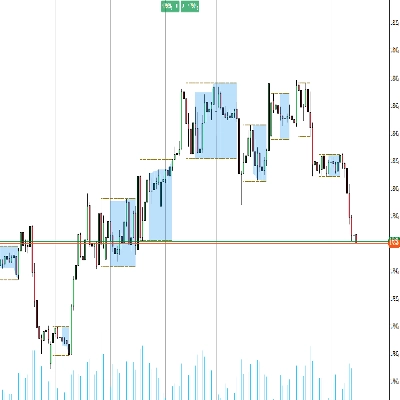
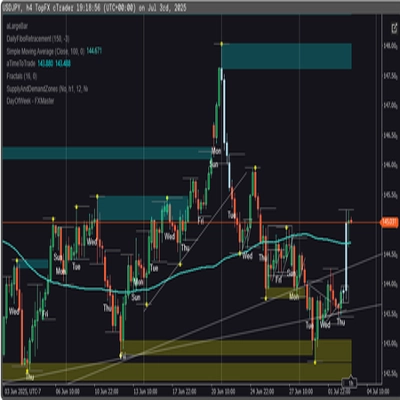
IR Spread is a trading indicator designed to display the spread directly on the chart during updates. It provides real-time visualization of the spread, helping traders monitor this key metric within their trading platform interface. The indicator integrates seamlessly with chart updates, ensuring that spread information is current and easily accessible.
Profil indikator

Diskusi

Ulasan pelanggan

5.0
Ulasan: 2
5
100 %
4
0 %
3
0 %
2
0 %
1
0 %
Ulasan pelanggan
June 4, 2026
didn't check deep enough so far but it seems perfect and smooth
November 18, 2025

Pertanyaan umum

Produk-produk yang tersedia melalui cTrader Store, termasuk bot trading, indikator, dan plugin, disediakan oleh pengembang pihak ketiga serta hanya ditujukan untuk akses teknis dan informasi. cTrader Store bukan broker dan tidak menyediakan saran investasi, rekomendasi pribadi, atau jaminan apa pun tentang kinerja di masa mendatang.

Produk lain dari penulis ini

Logo "IR Candle MTF"
4.6
(6)
Gratis
with this indicator you could see other time frame candle in your chart.
some user add moving average to macd to see better. in ctrader 4.3.11 there is a problem with this . I make a macd tha
this indicator show macd on chart.
Multi Time Frame Moving Average is a powerful and flexible indicator for cTrader
 this moving include everything that a trader needs from Moving Average.
this indicaotr show distance between Tenkan to Kijun, Close to Kijun and Close to Tenkan 
Add Slowing to IR Moving Average.
IR Candle Open plots customizable opening price lines for daily, weekly, and monthly candles
Coral indicator
you could put your check list in your chart you could split your test with “,” you could put your checklist in indicat
this indicator show other time frame close in lower time frame. for ex: show daily close in m 15.
don't move to the end of chart after timeframe changing. it should be better to use for near history. for long history

Anda mungkin juga suka

The Advanced Volume Profile Indicator calculates POC, Median, and Mode, revealing key price levels for smarter trading.
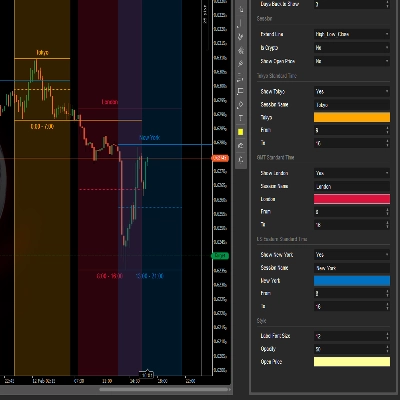
Track VWAP for Asia, London, NY, Sydney, Daily, Weekly, Monthly & Custom Sessions. Perfect for FX & intraday trading!
Advanced market structure and institutional cycle mapper with visual reference cards and entry alerts
Perfect Entry Price designed to help traders identify the most accurate and reliable price levels for market entries
Auto-detect swing highs/lows. Spot reversals, map structure, and filter noise with adjustable strength.
Overlay HTF context on any chart: color bars by HTF and draw filled HTF bodies with optional High/Low lines.
Protect your funded account. Real-time Daily Equity Drawdown monitor with Green / Orange / Red flashing alerts.
Identify and trade breakouts with Consolidation Zones! Visualize price consolidation areas for trading opportunities.
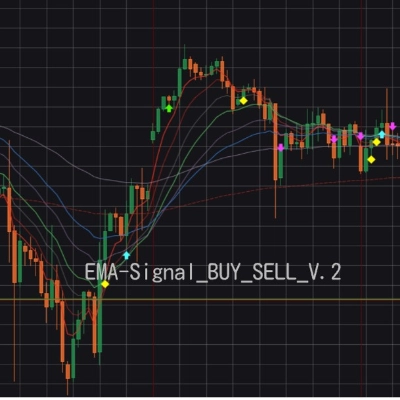
Nine timeframe cards, vivid candles, native BUY/SELL arrows and adjustable ATR-buffer stop-loss reference lines.
Track hidden trading activities to be on the right side of the market.
Day of Week Indicator for cTrader
The Advanced CCI & EMA Indicator combines the CCI with 40 & 80 EMA logic to generate precise arrows signaling direction
Smart Money Concepts (SMC) indicator with real-time Fair Value Gap (FVG) boxes, $50 round numbers, and live market HUD.
Visualize convergence, breakouts, and trends. Target
😎Read the description before purchasing💩
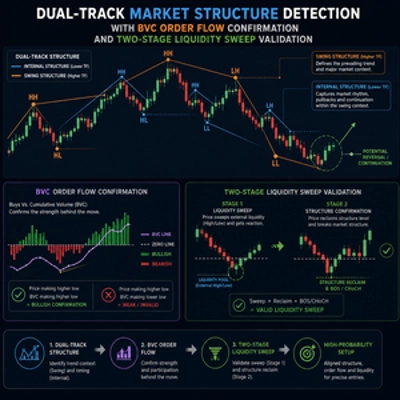
Dual-track market structure detection with BVC order flow confirmation and two-stage liquidity sweep validation.
Logo "Cross EMA Pro"
4.4
(5)
$49
Cross EMA Pro – Trend Reversal Indicator
Market structure signals graded A to C, each with a drawn trade plan, plus an adaptive trend ribbon and a trend matrix

Harga

5.63K
Instal gratis