
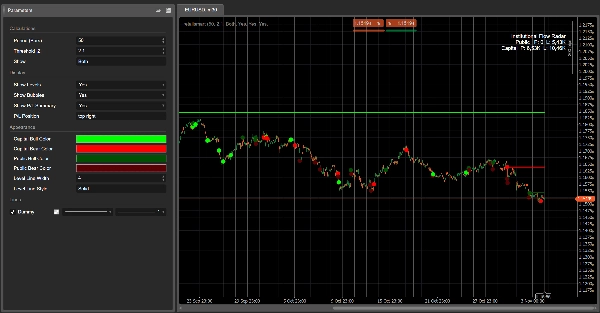
Institutional Flow Radar
Индикатор
3 покупки
Версия 1.0, Nov 2025
Windows, Mac
4.3
Отзывы: 3
Описание
Institutional Flow Radar – Описание
Концепция:
Institutional Flow Radar сканирует график на предмет аномальных событий объема и классифицирует их на две группы:
- Капитал → активность, приписываемая более сильным / информированным участникам
- Публика → активность, приписываемая широкой массе
Затем он:
- рисует горизонтальные уровни на этих событиях,
- отмечает наиболее значимые события цветными пузырьками,
- и показывает сводку P/L, сравнивая, какой объем Капитала и Публики в данный момент находится в прибыли или убытке.
С первого взгляда вы видите где большой объем попал на ленту, кто выигрывает, и какие цены еще держатся.
Как это работает (кратко)
- Для каждого бара алгоритм вычисляет Z-оценку объема за последние N баров (Период).
- Если абсолютное значение Z-оценки превышает ваш Порог |Z|, этот бар помечается как событие объема.
- Структура свечи (тело против общего диапазона) используется для классификации события:
-
- меньшее тело, длинные тени → Капитал (поглощение / более сложное поведение)
- большее тело, направленное движение → Публика (прорыв / погоня толпы)
- На цене события рисуется горизонтальный уровень и сохраняется, пока цена не пройдет этот уровень чисто (смягчение).
- Для каждого активного уровня Радар проверяет, находится ли текущая цена:
-
- в прибыли для этой стороны (цена двинулась в направлении события), или
- в убытке (цена двинулась против него).
- В окне сводки P/L агрегируются объемы всех активных уровней:
-
- Прибыль Капитала против Убытка Капитала
- Прибыль Публики против Убытка Публики
Визуальные элементы
- Уровни Капитала:
-
- События вверх → бычий уровень Капитала (например, ярко-зеленый / аквамариновый)
- События вниз → медвежий уровень Капитала (например, ярко-красный)
- Уровни Публики:
-
- События вверх → бычий уровень Публики (сероватый оттенок)
- События вниз → медвежий уровень Публики (темно-серый / угольный)
- Пузырьки:
-
- Круги на наиболее значимых событиях, окрашенные по:
-
- направлению (бычье/медвежье)
- классу (Капитал / Публика)
- Окно сводки P/L:
-
- Строки: Публика, Капитал
- Столбцы: Прибыль, Убыток
- Интенсивность фона ячейки увеличивается с соответствующим объемом.
Рекомендуемые метки параметров (английский)
- Период (бары): количество баров, используемых для вычисления Z-оценки объема.
- Порог |Z|: минимальное абсолютное значение Z-оценки для пометки события.
- Показать:
Capital,Public, илиBoth– какой класс отображать. - Показать уровни / Показать пузырьки / Показать сводку P/L
- Цвет бычьего Капитала / Цвет медвежьего Капитала
- Цвет бычьей Публики / Цвет медвежьей Публики
- Средняя ширина линии / Средний стиль линии
Сводка
ИИ-сводка
Institutional Flow Radar is a trading indicator that identifies and classifies abnormal volume events on price charts into two categories: Capital (activity from stronger or more informed participants) and Public (activity from the broader crowd). It calculates a volume Z-score for each bar over a specified period and flags bars exceeding a set threshold as volume events. These events are further classified based on candle structure—smaller bodies with long wicks indicate Capital activity, while larger bodies with directional moves indicate Public activity.
The indicator visually marks these events by drawing horizontal levels at event prices, which remain until price moves decisively through them. Significant events are highlighted with colored bubbles indicating direction (bullish or bearish) and classification (Capital or Public). A P/L summary box aggregates volume at active levels, showing Capital and Public volumes currently in profit or loss.
Users can customize parameters such as the period for Z-score calculation, threshold for event detection, and visual settings including colors for bullish and bearish levels for both Capital and Public groups. This tool provides a consolidated view of where large volume occurred, which participant group is prevailing, and which price levels are holding, aiding in volume-based breakout analysis.
Профиль индикатора
Отзывы покупателей
4.3
Отзывы: 3
5 | 33 % | |
4 | 67 % | |
3 | 0 % | |
2 | 0 % | |
1 | 0 % |
Отзывы покупателей
November 18, 2025
The only reason it stays interesting is the trading notes stop feeling so random, and two sessions say more than one clean chart.
November 9, 2025
Обсуждение
Частые вопросы
Breakout
Продукты, доступные в cTrader Store, включая торговых ботов, индикаторы и плагины, предоставляются сторонними разработчиками и доступны исключительно в информационных и технических целях. cTrader Store не является брокером и не предоставляет инвестиционные консультации, персональные рекомендации или какие-либо гарантии будущей доходности.


![Логотип продукта "[Stellar Strategies] MARSI Signal Plotter"](https://cdn.ctrader.com/image/webp/7b2b8da6-8f8e-4646-8d4a-4710c516c01e_25567)


Цена
42.11M
Торгуемый объем
6.13M
Выигранные пипы
222
Продажи
8.39K
Бесплатные установки