
Mô tả
MACD Pro Trader – Chỉ Báo Giao Dịch MACD Tối Ưu 🚀
Bạn đang tìm kiếm một chỉ báo MACD mạnh mẽ, chuyên nghiệp để nâng cao chiến lược giao dịch của mình? MACD Pro Trader là công cụ tối ưu được thiết kế dành cho các nhà giao dịch muốn có độ chính xác, rõ ràng và tín hiệu hiệu suất cao trong các quyết định giao dịch. Dù bạn là người mới hay nhà giao dịch có kinh nghiệm, chỉ báo MACD tiên tiến này sẽ giúp bạn xác định xu hướng thị trường, phát hiện các thiết lập giao dịch có xác suất cao và tối đa hóa lợi nhuận với sự tự tin!
🔥 Tại sao chọn MACD Pro Trader?
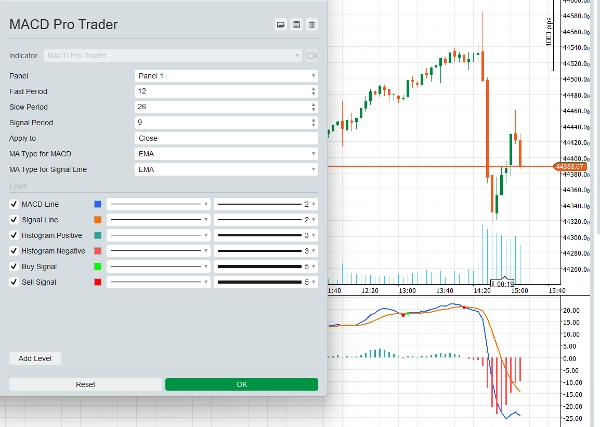
✅ Tùy chỉnh Trung bình Động Nâng cao – Chọn giữa SMA (Trung bình Động Đơn giản) hoặc EMA (Trung bình Động Lũy thừa) cho cả đường MACD và đường Tín hiệu, cho bạn toàn quyền kiểm soát cách chỉ báo thích ứng với các điều kiện thị trường khác nhau.
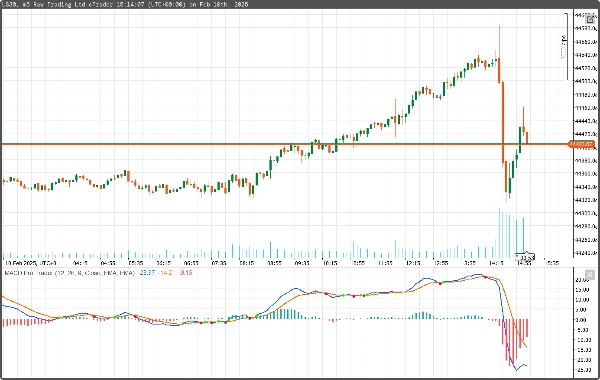
✅ Tín hiệu Mua & Bán Thông minh – Nhận tín hiệu vào và ra rõ ràng với các dấu hiệu màu xanh lá cây và đỏ dễ phân biệt, chỉ ra khi đường MACD cắt qua đường Tín hiệu. Không còn phải do dự khi vào lệnh nữa!
✅ Biểu đồ Cột Hai Màu cho Hiển thị Xu hướng Tốt hơn – Các thanh biểu đồ dương và âm được mã màu, giúp bạn ngay lập tức nhận biết khi động lượng chuyển hướng có lợi cho bạn.
✅ Tùy chọn Giá Áp dụng Linh hoạt – Áp dụng các phép tính MACD cho Giá Mở cửa, Cao, Thấp, Đóng cửa, Trung bình, Điển hình hoặc Trọng số để tinh chỉnh chỉ báo phù hợp với phong cách giao dịch của bạn.
✅ Hoàn hảo cho Giao dịch Trong Ngày & Giao dịch Dao động – Được thiết kế để hoạt động trên Forex, Cổ phiếu, Chỉ số và Tiền điện tử, dù bạn đang giao dịch biểu đồ 1 phút hay khung thời gian 4 giờ.
✅ Tích hợp Mượt mà với cTrader – Tối ưu hoàn toàn cho cTrader với hiệu suất thời gian thực và độ trễ tối thiểu, mang lại lợi thế so với các chỉ báo MACD truyền thống.
📈 Cách sử dụng MACD Pro Trader cho Giao dịch Trong Ngày
Chiến lược: Giao cắt MACD + Xác nhận Động lượng
Chiến lược đơn giản nhưng mạnh mẽ này được thiết kế để nắm bắt các biến động giá ngắn hạn và tối đa hóa lợi nhuận trong các thị trường có xu hướng.
🔹 Bước 1: Xác định Xu hướng
- Sử dụng Giao cắt Đường MACD & Đường Tín hiệu làm tín hiệu kích hoạt đầu tiên của bạn.
- Tìm MACD cắt lên trên đường Tín hiệu cho một thiết lập tăng giá.
- Tìm MACD cắt xuống dưới đường Tín hiệu cho một thiết lập giảm giá.
🔹 Bước 2: Xác nhận với Biểu đồ Cột
- Một biểu đồ cột dương tăng trưởng xác nhận động lượng tăng giá mạnh.
- Một biểu đồ cột âm tăng trưởng xác nhận động lượng giảm giá mạnh.
- Nếu biểu đồ cột yếu hoặc phẳng, hãy chờ tín hiệu mạnh hơn.
🔹 Bước 3: Vào Lệnh
- Vào lệnh Mua: Khi MACD cắt lên trên đường Tín hiệu và biểu đồ cột chuyển sang màu xanh.
- Vào lệnh Bán: Khi MACD cắt xuống dưới đường Tín hiệu và biểu đồ cột chuyển sang màu đỏ.
🔹 Bước 4: Đặt Stop Loss & Take Profit
- Stop Loss: Đặt stop loss ngay dưới đáy swing gần nhất (cho lệnh mua) hoặc trên đỉnh swing gần nhất (cho lệnh bán).
- Take Profit: Nhắm tới 2 lần mức stop loss để có tỷ lệ rủi ro-lợi nhuận tốt (ví dụ: rủi ro 10 pips để thu lợi 20 pips).
🔹 Mẹo Thêm: Sử dụng Khung Thời gian Cao hơn để Xác nhận
Trước khi vào lệnh, kiểm tra khung thời gian cao hơn (ví dụ: 15 phút nếu giao dịch khung 5 phút) để xác nhận hướng xu hướng. Nếu cả hai khung thời gian đều đồng thuận, giao dịch của bạn sẽ có xác suất thành công cao hơn!
🎯 MACD Pro Trader dành cho ai?
✅ Nhà giao dịch Forex tìm kiếm tín hiệu MACD chính xác cao.
✅ Scalper & nhà giao dịch trong ngày cần điểm vào lệnh nhanh và đáng tin cậy.
✅ Nhà giao dịch Cổ phiếu & Tiền điện tử muốn theo xu hướng với sự tự tin.
✅ Nhà giao dịch Swing muốn xác định các chuyển động động lượng dài hạn.
Nếu bạn đã mệt mỏi vì bỏ lỡ các giao dịch tốt hoặc khó khăn trong việc xác định thời điểm vào lệnh, MACD Pro Trader chính là giải pháp bạn đang chờ đợi!
💎 Sở hữu MACD Pro Trader ngay hôm nay & Nâng tầm Giao dịch của bạn!
🔹 Tối ưu 100% cho cTrader – Không trễ, không vẽ lại, chỉ tín hiệu rõ ràng và có thể hành động.
🔹 Tải xuống ngay lập tức – Bắt đầu sử dụng trong vài phút!
🔹 Cập nhật trọn đời – Nhận tất cả các cải tiến trong tương lai mà không mất thêm phí.
📥 Nhận bản sao của bạn ngay và bắt đầu giao dịch thông minh hơn! 🚀
Tóm tắt
A dual-tone histogram visually represents momentum shifts with color-coded positive and negative bars, enhancing trend analysis. Users can apply MACD calculations to various price types including Open, High, Low, Close, Median, Typical, or Weighted prices to tailor the indicator to their trading style.
MACD Pro Trader is suitable for scalpers, day traders, swing traders, and those seeking to identify both short-term and long-term momentum changes. It is optimized for real-time performance with minimal lag on cTrader. The product includes a recommended trading strategy based on MACD line and Signal line crossovers confirmed by histogram momentum, with guidance on entry, stop loss, and take profit placement. Higher timeframe confirmation is suggested to improve trade probability. The indicator supports multiple timeframes from 1-minute scalping to 4-hour swing trading.
Đánh giá của khách hàng
5 | 50 % | |
4 | 50 % | |
3 | 0 % | |
2 | 0 % | |
1 | 0 % |


