
VolumeColorBar
Indicatore
10 acquisti
Versione 1.2, Apr 2026
Windows, Mac
4.3
Recensioni: 3
Descrizione
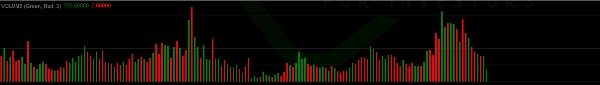
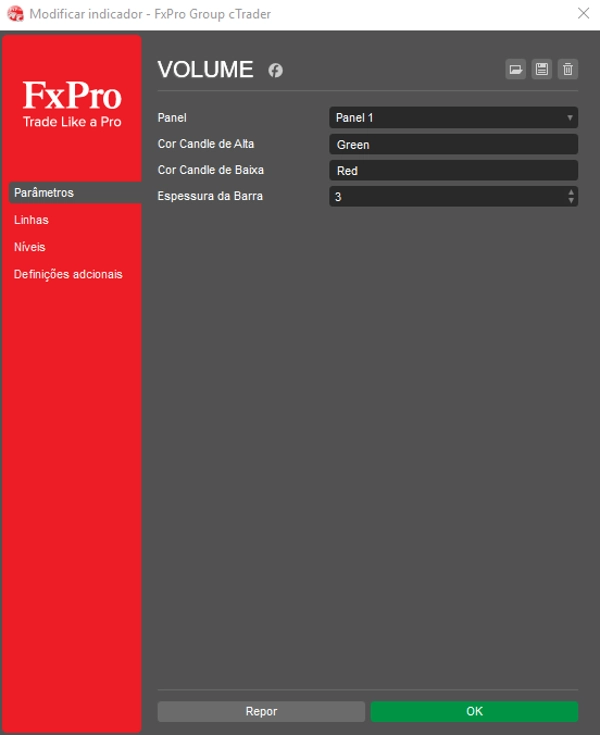
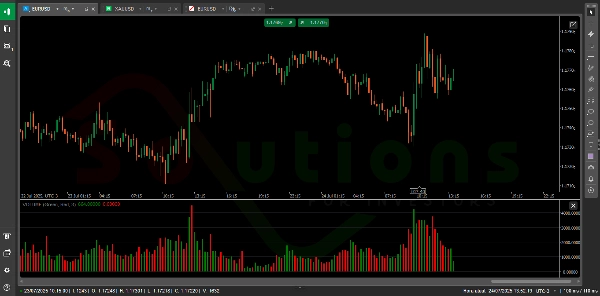
VolumeColorBar è uno strumento potente che rappresenta visivamente il volume di mercato utilizzando barre codificate a colori basate sulla direzione della candela. Le barre verdi indicano il volume sulle candele rialziste (pressione di acquisto), mentre le barre rosse riflettono il volume sulle candele ribassiste (pressione di vendita). Questo permette ai trader di valutare istantaneamente se l'attività di mercato è guidata più dagli acquirenti o dai venditori — aiutando a confermare le rotture, identificare i ribaltamenti e migliorare il tempismo delle operazioni con maggiore fiducia.
Riepilogo
Riepilogo AI
VolumeColorBar is a trading indicator that visualizes market volume using color-coded bars aligned with candle direction. It displays green bars for volume on bullish candles, indicating buying pressure, and red bars for volume on bearish candles, indicating selling pressure. This visual representation helps traders quickly assess whether market activity is dominated by buyers or sellers. The indicator supports various markets and symbols, including Forex pairs (EURUSD, GBPUSD, NZDUSD, USDJPY), cryptocurrencies (BTCUSD, crypto), commodities (XAUUSD, gold, oil, silver), indices (NAS100, SP500, DAX, Dow), and stocks. By providing immediate insight into volume dynamics relative to price movement, VolumeColorBar aids in confirming breakouts, identifying potential reversals, and improving trade timing decisions.
Profilo indicatore
Recensioni dei clienti
4.3
Recensioni: 3
5 | 33 % | |
4 | 67 % | |
3 | 0 % | |
2 | 0 % | |
1 | 0 % |
Recensioni dei clienti
April 14, 2025
Clean tool for workflow for a more controlled workflow. It helps with planning entries around the first range, but false breaks still need filtering. I would track 20 market opens, the first 30 to 60 minutes and a target near 1.5R. I would still keep manual review in the process.
April 13, 2025
April 13, 2025
Worth a closer look around opening range breakouts. The useful part is planning entries around the first range, with the numbers checked before scaling. The setup should be tested across at least 15 sessions because 2 or 3 fakeouts can change the picture. The trade idea is clear, but it needs a hard stop and a defined breakout rule.
Discussioni
Domande frequenti
BTCUSD
Forex
Signal
Breakout
Indices
EURUSD
Commodities
GBPUSD
NZDUSD
Prop
Crypto
Stocks
XAUUSD
NAS100
USDJPY
I prodotti disponibili tramite cTrader Store, inclusi bot di trading, indicatori e plugin, sono forniti da sviluppatori terzi e resi disponibili esclusivamente a scopo informativo e di accesso tecnico. cTrader Store non è un broker e non fornisce consulenze in materia di investimento, raccomandazioni individualizzate o garanzie di risultati futuri.


Prezzo
Da 05/02/2025
31
Vendite