
Penerangan
RSI Tersuai – Pembalikan Spot dengan Ketepatan dan Visual Bersih
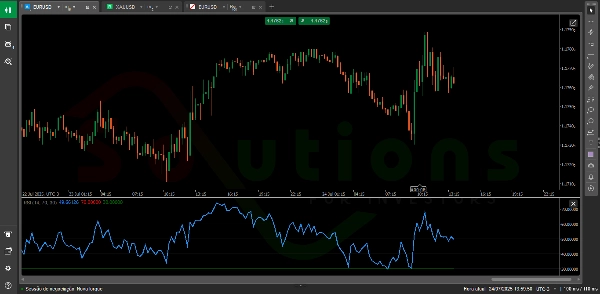
RSI Tersuai adalah versi dipertingkatkan bagi Indeks Kekuatan Relatif (RSI) klasik, direka untuk membantu pedagang mengenal pasti dengan cepat zon terlebih beli dan terlebih jual— kawasan utama di mana harga berkemungkinan untuk berbalik.
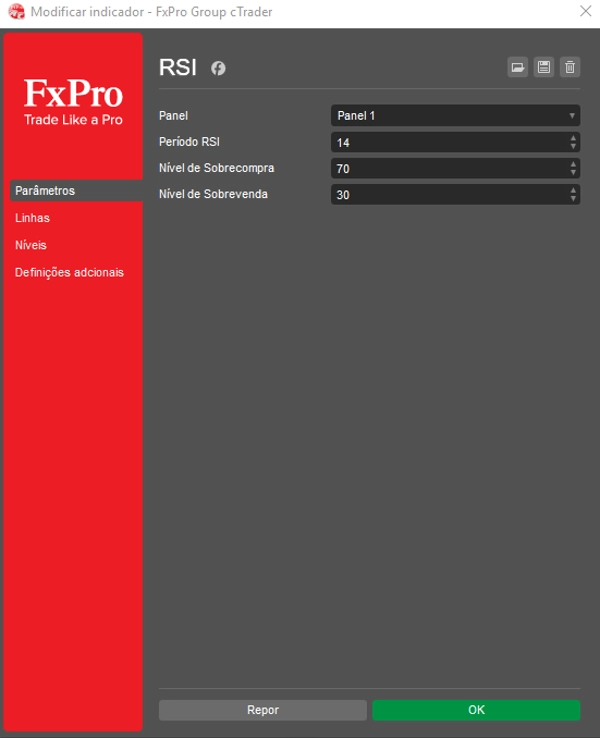
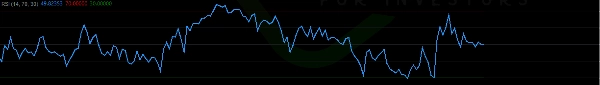
Dengan antara muka yang bersih dan intuitif, ia memaparkan dua garis mendatar yang boleh disesuaikan sepenuhnya (seperti tahap tradisional 70 dan 30), menandakan dengan jelas titik keputusan berkemungkinan tinggi pada carta.
✅ Laraskan jangka masa dan tahap RSI mengikut gaya dagangan anda
✅ Kenal pasti zon pembalikan berpotensi dengan keyakinan lebih tinggi
✅ Tingkatkan analisis teknikal anda dengan penunjuk yang jelas dan tanpa kekacauan
Sesuai untuk pedagang dari semua peringkat, RSI Tersuai mengubah data harga mentah menjadi pandangan pintar dan boleh diambil tindakan—menjadikannya alat penting untuk membuat keputusan yang menguntungkan.
Ringkasan
Ulasan pelanggan
5 | 0 % | |
4 | 100 % | |
3 | 0 % | |
2 | 0 % | |
1 | 0 % |


