
Descrizione
🟢 Indicatore Smooth Heiken Ashi per cTrader
Fai trading con chiarezza. Segui il trend con fiducia.
L'indicatore Smooth Heiken Ashi è uno strumento di grafico raffinato progettato per filtrare il rumore di mercato e mettere in evidenza il vero slancio del prezzo. Creato per la piattaforma cTrader, questo indicatore combina le tradizionali candele Heiken Ashi con un algoritmo di smoothing per fornire segnali di trend più puliti e affidabili.
🔍 Caratteristiche principali
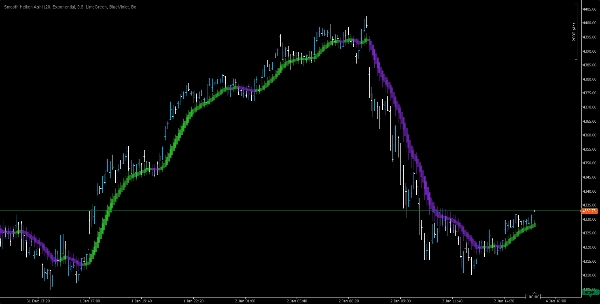
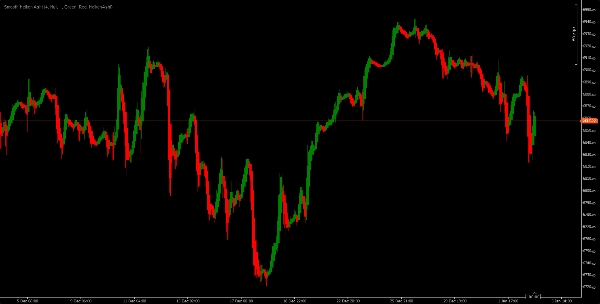
• Candele Heiken Ashi levigate
Riduci i falsi segnali e l'azione del prezzo irregolare con candele visivamente migliorate che enfatizzano la direzione del trend.
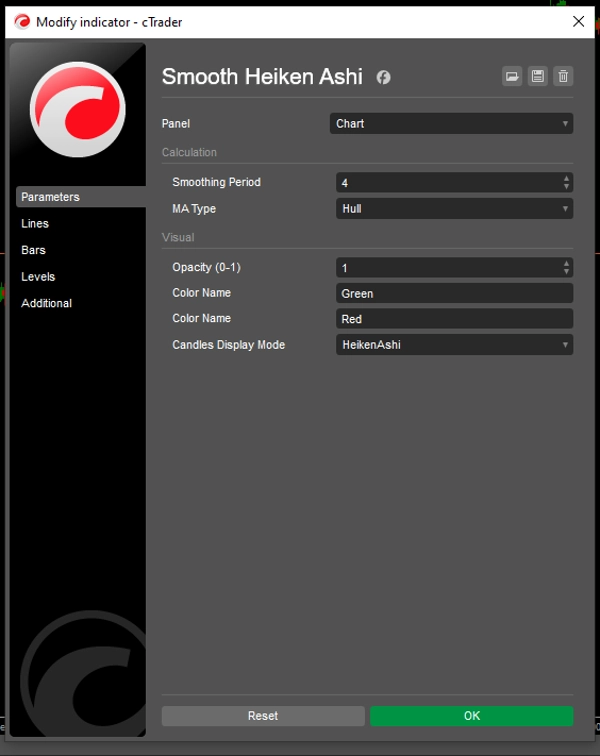
• Opzioni di smoothing personalizzabili
Regola finemente il fattore di smoothing per adattarlo al tuo stile di trading—che tu faccia scalping o swing trading.
• Linea di sovrapposizione del trend
Una curva dinamica si sovrappone alle candele per rafforzare la forza del trend e le potenziali inversioni.
• Aspetto pulito
Gradienti di colore eleganti e design minimalista rendono i tuoi grafici più facili da leggere e interpretare.
📈 Ideale per
• Strategie di follow-the-trend
• Conferma del momentum
• Filtraggio del rumore di mercato
• Trader visivi in cerca di chiarezza e precisione
Smooth Heiken Ashi ti aiuta a rimanere concentrato su ciò che conta—la direzione del prezzo, non le distrazioni. Che tu stia costruendo un sistema algoritmico o facendo trading manualmente, questo indicatore aggiunge un livello di fiducia alla tua analisi.
Riepilogo
Recensioni dei clienti
5 | 100 % | |
4 | 0 % | |
3 | 0 % | |
2 | 0 % | |
1 | 0 % |


