
Descrizione
📈 Indicatore AutoFibRetracement
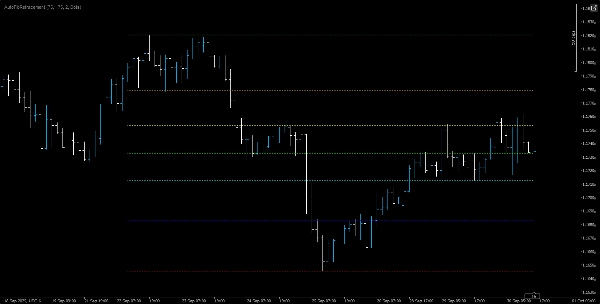
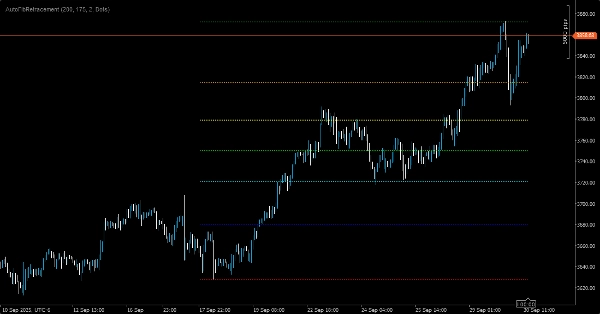
L'indicatore AutoFibRetracement è uno strumento sovrapposto potente progettato per tracciare automaticamente i livelli di ritracciamento di Fibonacci basati sulle oscillazioni di prezzo recenti. Ideale per i trader che cercano di identificare potenziali zone di supporto e resistenza, questo indicatore calcola dinamicamente i livelli di ritracciamento utilizzando parametri personalizzabili e li visualizza direttamente sul grafico.
🔧 Caratteristiche principali:
• Rilevamento automatico delle oscillazioni: calcola i massimi e i minimi delle oscillazioni all'interno di una finestra di lookback definita dall'utente.
• Finestra del periodo personalizzabile: I trader devono selezionare una finestra appropriata per catturare accuratamente i massimi e i minimi significativi delle oscillazioni. Questa scelta è cruciale per allineare i livelli di ritracciamento con la struttura reale del mercato.
• Livelli di Fibonacci: include rapporti standard — 0%, 23,6%, 38,2%, 50%, 61,8%, 78,6% e 100% — ciascuno codificato a colori per chiarezza visiva.
• Opzioni di stile visivo:
• Opacità regolabile (0–255) per la trasparenza delle linee.
• Spessore e stile della linea configurabili (ad esempio, puntinato, solido).
• Visualizzazione sovrapposta: disegna direttamente sul grafico dei prezzi per un'integrazione senza soluzione di continuità con altri strumenti di analisi tecnica.
🎯 Caso d'uso:
Perfetto per swing trader, follower di tendenza e analisti tecnici che si affidano alle zone di ritracciamento di Fibonacci per pianificare ingressi, uscite e livelli di stop-loss. L'efficacia di questo indicatore dipende dalla capacità del trader di scegliere la dimensione della finestra corretta — troppo corta potrebbe far perdere oscillazioni più ampie, troppo lunga potrebbe diluire l'azione di prezzo recente.


![Logo di "[Hamster-Coder] Pivot Points MTF"](https://cdn.ctrader.com/image/webp/4c143e5a-309c-40e3-a578-f04d1e133ffa_31159)


![Logo di "[Stellar Strategies] Linear Regression Candles 1.1"](https://cdn.ctrader.com/image/webp/8b9cff9f-2431-46d2-b0ec-c7f55f4a4a6d_27918)

