Descrizione
Questo indicatore cTrader identifica e visualizza il primo specifico squilibrio di mercato che si verifica durante le tre principali sessioni di trading di New York. È progettato per i praticanti ICT (Inner Circle Trader) che si concentrano sulle configurazioni "presentate per prime" come impronte istituzionali ad alta probabilità.
核心 (Core) Functionality
L'indicatore monitora il mercato a partire dall'apertura di ogni sessione e "blocca" il primissimo squilibrio che trova. Una volta che un tipo di squilibrio (come un FVG) è stato disegnato per una specifica sessione, non ne disegnerà un altro dello stesso tipo fino all'inizio della sessione successiva.
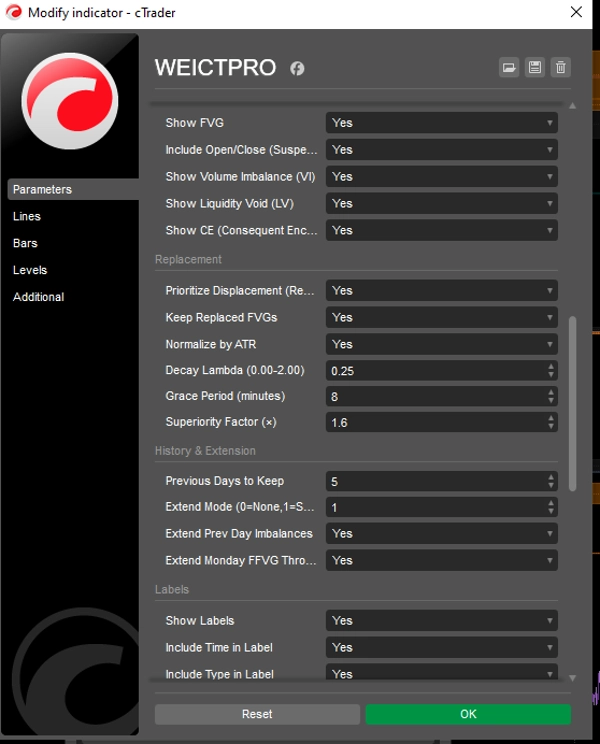
1. Tipi di squilibrio rilevati
- Fair Value Gap (FVG): Una struttura di tre candele in cui la shadow della prima candela e la shadow della terza candela non si sovrappongono, lasciando un "gap" nell'intervallo di prezzo della seconda candela.
- Volume Imbalance (VI): Si verifica quando c'è un gap tra i corpi (Apertura/Chiusura) di due candele consecutive, anche se le shadow si sovrappongono.
- Liquidity Void (LV): Un gap più estremo in cui non c'è alcuna azione di prezzo tra le shadow di due candele consecutive (un "salto" totale nel prezzo).
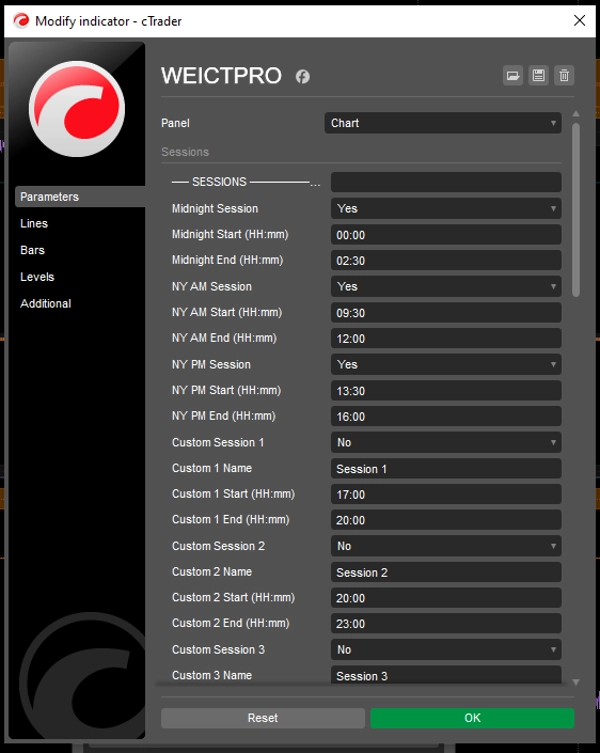
2. Sessioni monitorate (ora di New York)
L'indicatore converte automaticamente l'ora del tuo grafico in Eastern Time (ET) per tracciare:
- Mezzanotte: 00:00 – 02:30
- NY AM: 09:30 – 12:00
- NY PM: 13:30 – 16:00
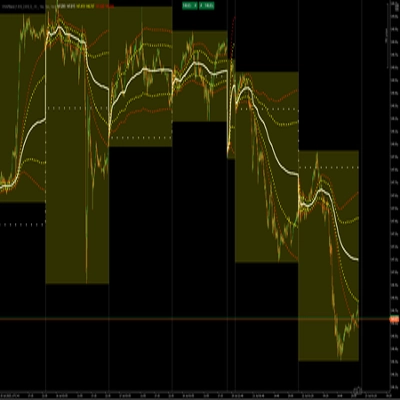
Caratteristiche visive
- Estensione dinamica: Le caselle sono disegnate dal punto di origine e si estendono automaticamente in avanti per un numero di barre definito dall'utente (
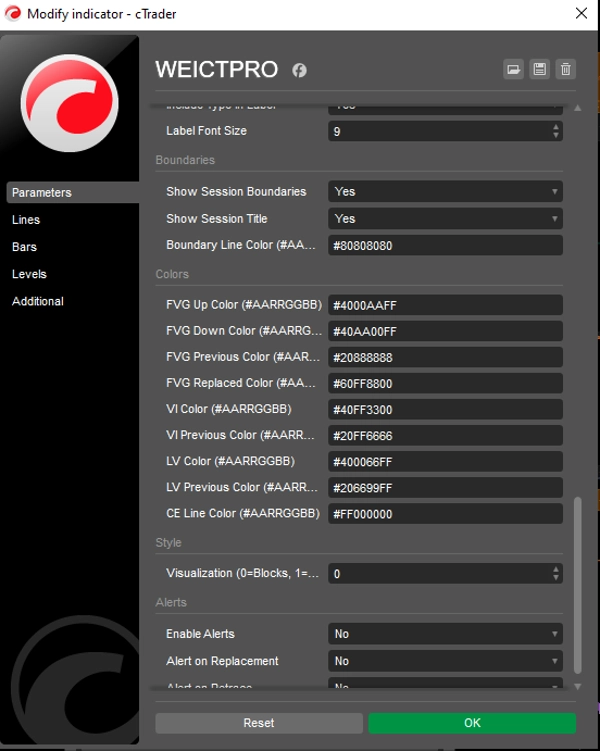
Extend Bars) per mostrare potenziali supporti/resistenze futuri. - Encroachment Conseguente (CE): Disegna una linea tratteggiata centrale attraverso lo squilibrio. Nella teoria ICT, il livello 50% (CE) è un punto di riferimento istituzionale critico.
- Etichettatura automatica: Segna chiaramente ogni casella con il nome della sessione e il tipo di squilibrio (es. "NY AM +FVG").
Parametri chiave
Parametro
Descrizione
Mostra FVG/VI/LV
Attiva quali tipi specifici di squilibrio vuoi monitorare.
Opacità della casella
Regola quanto appaiono "solide" le aree ombreggiate sul tuo grafico.
Estendi barre
Quante candele nel futuro la casella dovrebbe proiettare.
Fuso orario
Codificato in modo fisso su Eastern Standard Time per garantire l'accuratezza della sessione indipendentemente dall'ora del server del tuo broker.
Raccomandazioni tecniche
- Timeframe: Migliore utilizzo su M1 fino a M15. Su timeframe più alti (H1+), le sessioni sono troppo brevi per catturare in modo affidabile il "primo" squilibrio presentato.
- Uso: Queste aree spesso agiscono come "magneti" per il prezzo. I trader cercano che il prezzo ritorni in queste caselle (specificamente al livello CE) per entrare prima di continuare nella direzione originale.
Riepilogo
The indicator detects three imbalance types: Fair Value Gap (FVG), a three-candle gap where the first and third candle wicks do not overlap; Volume Imbalance (VI), a gap between the bodies of two consecutive candles; and Liquidity Void (LV), a total price jump with no price action between consecutive candle wicks. Once an imbalance type is identified in a session, it locks and does not redraw until the next session.
Visual features include dynamically extending boxes from the imbalance origin for a user-defined number of bars, a dashed midline marking the 50% level (Consequent Encroachment), and automated labeling with session and imbalance type. The indicator is hardcoded to Eastern Time for session accuracy and is best used on M1 to M15 timeframes to reliably capture the first imbalance. Users can toggle imbalance types, adjust box opacity, and set extension length. This tool supports multiple markets including Forex, indices, commodities, stocks, and cryptocurrencies.