
Descrizione
Profilo TPO giornaliero
Indicatore del profilo TPO giornaliero che calcola POC, VAH e VAL per ogni sessione.
Traccia il Punto di Controllo e l'Area di Valore al 70% direttamente sul grafico, aiutandoti a identificare zone di valore equo, livelli chiave di supporto/resistenza e potenziali aree di rifiuto o accettazione del prezzo.
Come funziona
Questo indicatore costruisce un profilo TPO (Time Price Opportunity) giornaliero, simile a un Market Profile.
Per ogni barra della giornata di trading, esso:
- divide l'asse dei prezzi in “passi” fissi definiti da “Dimensione Riga (pips)”
- per ogni passo di prezzo, conta quante barre hanno toccato quel livello (TPO = quante volte il prezzo ha negoziato lì)
- alla fine della giornata calcola:
-
- POC (Punto di Controllo) → il livello di prezzo con il maggior numero di TPO (dove il mercato ha trascorso più tempo)
- VAH (Valore Area Alto) e VAL (Valore Area Basso) → i livelli di prezzo che contengono approssimativamente Percentuale Area Valore (default 70%) di tutti i TPO per quella sessione
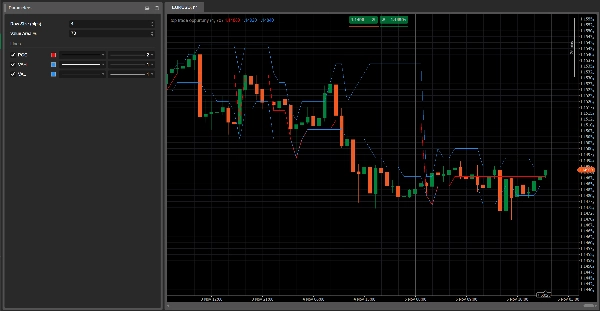
L'indicatore traccia tre linee orizzontali sul grafico:
- Linea rossa → POC
- Linee blu → VAH (superiore) e VAL (inferiore)
Queste linee vengono aggiornate barra per barra durante la sessione e resettate all'inizio di una nuova giornata di trading.
Parametri principali
Dimensione Riga (pips)
Definisce lo spessore di ogni passo di prezzo nel profilo.-
- Valori più piccoli = profilo più dettagliato
- Valori più grandi = profilo più liscio
Percentuale Area Valore
Percentuale del totale dei TPO contenuta all'interno dell'Area Valore (tipicamente 70%).
L'Area Valore è la zona di prezzo dove si è verificata la maggior parte dell'attività di mercato durante la giornata.
Come leggerlo
- POC (linea rossa)
-
- Il livello di prezzo più “accettato” dal mercato durante quella giornata.
- Spesso agisce come un livello di equilibrio: il prezzo può rimbalzare, fermarsi o rompere fortemente intorno a questa zona.
- Area Valore (VAH–VAL, linee blu)
-
- Rappresenta la zona di “valore equo” dove si è svolta la maggior parte delle negoziazioni.
- L'azione del prezzo rispetto a VAH/VAL può mostrare:
-
- Rifiuto di prezzi estremi (falsi breakout oltre VAH/VAL)
- Accettazione di nuovi prezzi (consolidamento fuori dall'Area Valore)
Idee tipiche di utilizzo
- Il prezzo rifiuta VAL e torna all'interno dell'Area Valore → possibile idea long, puntando a un ritorno al “valore equo” (reversione alla media).
- Il prezzo rompe con forza sopra VAH e inizia a costruire struttura sopra → possibile inizio di una nuova area di valore più alta (scenario di trend-following).
- Più giorni con POC intorno allo stesso livello → forte zona di equilibrio/accumulazione, spesso supporto/resistenza chiave.
Riepilogo
The indicator plots these levels as horizontal lines on the chart—POC in red, VAH and VAL in blue—updating them bar by bar during the session and resetting daily. Traders use the POC as an equilibrium price level that may act as support or resistance. The Value Area highlights fair value zones, with price action near VAH and VAL signaling potential rejection or acceptance of price extremes. Typical applications include identifying mean reversion opportunities when price rejects VAL or trend-following setups when price breaks above VAH.
Main adjustable parameters include Row Size (pips), controlling profile detail, and Value Area %, defining the percentage of TPOs included in the value area. The indicator supports analysis across various markets including forex, indices, commodities, stocks, and cryptocurrencies.


