
Descrizione
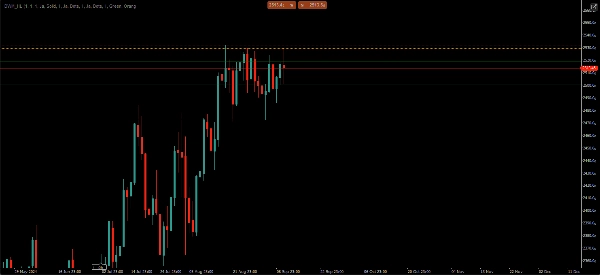
Livelli di Liquidità NGS – Massimi e Minimi Giornalieri • Settimanali • Mensili
Operare intorno alla liquidità, non intorno a linee casuali.
I Livelli di Liquidità NGS mostrano automaticamente i livelli di liquidità più importanti Giornalieri, Settimanali e Mensili su ogni grafico.
• Nessun disegno manuale
• Nessun cambio di timeframe
• Nessun ingombro sul grafico
Questo indicatore intuitivo aiuta i trader a identificare in pochi secondi i livelli chiave di liquidità e struttura di mercato. Invece di segnare manualmente massimi e minimi ogni giorno, i livelli più importanti vengono mostrati e aggiornati automaticamente per te.
Caratteristiche:
• Livelli automatici di Massimo e Minimo Giornaliero
• Livelli automatici di Massimo e Minimo Settimanale
• Livelli automatici di Massimo e Minimo Mensile
• Livelli opzionali del periodo precedente
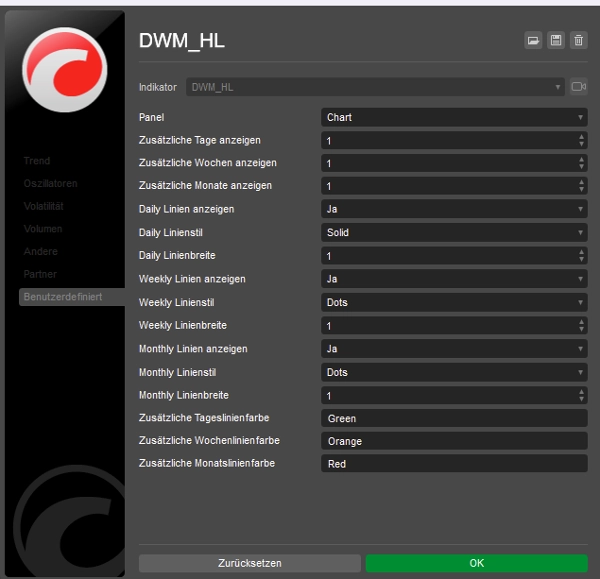
• Colori e stili di linea personalizzabili
• Visualizzazione pulita e leggera del grafico
• Funziona su Forex, Indici, Commodities e Crypto
• Supporta più timeframe
• Non ridisegna
Progettato per trader che si concentrano sulla struttura di mercato, la liquidità e i livelli di timeframe superiori.
Nessun segnale.
Nessuna strategia.
Nessuna promessa di profitto.
Solo livelli di liquidità oggettivi e un flusso di lavoro di trading più pulito.
Riepilogo
Recensioni dei clienti
5 | 100 % | |
4 | 0 % | |
3 | 0 % | |
2 | 0 % | |
1 | 0 % |


![Logo di "[Hamster-Coder] Pivot Points MTF"](https://cdn.ctrader.com/image/webp/4c143e5a-309c-40e3-a578-f04d1e133ffa_31159)


