
Descrizione
Zone di Liquidità Heatmap
Visualizza il volume per prezzo, scopri supporti/resistenze nascosti e monitora la liquidità del mercato in tempo reale.
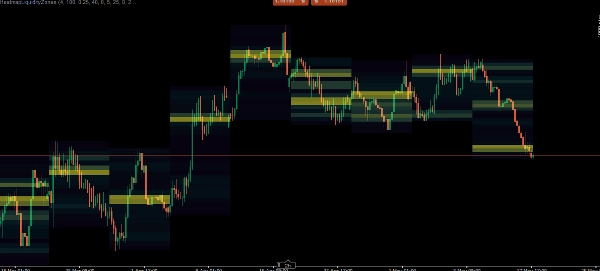
L'indicatore Zone di Liquidità Heatmap è uno strumento potente di profilazione del volume che trasforma i dati di mercato grezzi in una heatmap visiva intuitiva. Analizzando il volume dei tick su specifici timeframe superiori (HTF), identifica esattamente dove si concentra la pressione di acquisto e vendita più significativa.
Invece di indovinare dove il mercato potrebbe invertire, questo indicatore traccia livelli di liquidità precisi e supportati dal volume. Questi livelli si estendono in avanti in modo dinamico e scompaiono automaticamente una volta che il prezzo li rompe e li invalida, mantenendo il tuo grafico pulito e strettamente rilevante per l'azione di prezzo attuale.
Caratteristiche Principali
Heatmap Multi-Timeframe: Seleziona il tuo macro timeframe preferito (1H, 4H, Giornaliero, Settimanale o Mensile). L'indicatore mapperà la distribuzione del volume per quel periodo specifico direttamente sui tuoi grafici a timeframe inferiori.
Suddivisione Dinamica ATR: La scala dei prezzi è suddivisa in "bin" (zone) dinamici calcolati usando l'Average True Range (ATR). Questo assicura che la heatmap si adatti in modo intelligente sia ai mercati altamente volatili che a quelli in consolidamento stretto.
Livelli di Liquidità Auto-Invalidanti: Quando un bin di prezzo specifico accumula un volume enorme, diventa un "Livello di Liquidità". L'indicatore disegna una linea solida che si estende nel futuro. Se il prezzo rompe con successo questo livello, la linea viene rimossa automaticamente (invalidata).
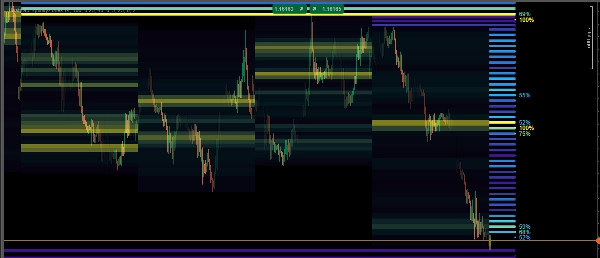
Colorazione a Gradiente di Densità: Distingui visivamente tra nodi di volume Basso, Medio e Alto. La heatmap usa un gradiente di colore per mostrarti esattamente dove è intrappolato il volume più pesante.
Tracciamento Percentuale: I livelli di liquidità ad alta densità mostrano un'etichetta percentuale (es. 85%), indicando esattamente quanto è forte quel nodo rispetto al resto del volume del periodo HTF.
Riepilogo
The indicator segments the price scale into dynamic zones based on the Average True Range (ATR), adapting to market volatility. It highlights significant volume clusters as liquidity levels with solid lines extending forward. These lines automatically disappear if the price breaks through the level, ensuring the chart remains focused on relevant, current price action.
A color gradient visually distinguishes low, medium, and high volume nodes, while percentage labels indicate the relative strength of high-density liquidity levels within the chosen timeframe. This tool supports traders in tracking market liquidity in real-time and making volume-backed decisions regarding support and resistance areas.
Recensioni dei clienti
5 | 100 % | |
4 | 0 % | |
3 | 0 % | |
2 | 0 % | |
1 | 0 % |


