Descrizione
Profilo di Liquidità e Assorbimento delle Balene
Traccia il denaro istituzionale, analizza il flusso degli ordini e individua le zone di inversione con precisione volumetrica
Il Profilo di Liquidità e Assorbimento delle Balene non è il tuo tradizionale profilo di volume. È una suite di analisi della microstruttura di mercato che scompone ogni transazione per mostrarti non solo dove il volume è stato scambiato, ma chi lo ha scambiato (istituzionale vs. retail) e come il prezzo ha interagito a quei livelli (aggressività vs. assorbimento).
Presenta un motore di rendering ottimizzato che proietta tutti i dati a destra del prezzo corrente, mantenendo il tuo grafico completamente pulito e senza ritardi.
Caratteristiche principali
- Filtro di Forza (Solo Balene): Utilizza un algoritmo percentuale (ad esempio, top 97%) per separare il volume istituzionale ("Forte") dal volume retail ("Debole"). Puoi attivare la modalità "Solo Forte" per tracciare esclusivamente l'impronta del denaro intelligente.
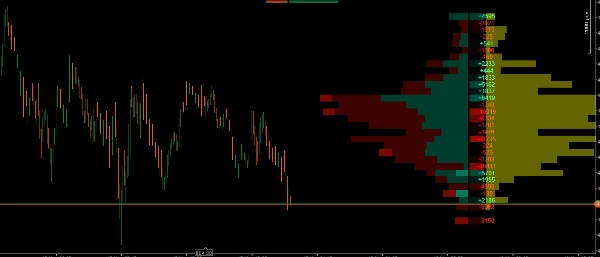
- Profilo di Volume Impilato: Visualizza la distribuzione del volume rialzista e ribassista per livello di prezzo, facilitando l'identificazione del Punto di Controllo (POC) e dei Nodi di Volume Alto/Basso (HVN/LVN).
- Rilevamento Automatico dell'Area di Valore: Evidenzia i livelli di prezzo dove è stato scambiato il più alto percentuale di volume (default 70%), attenuando le zone esterne per leggere facilmente il contesto di mercato a colpo d'occhio.
- Profilo Delta (Mappa di Calore): Calcola la differenza esatta tra acquisti e vendite di mercato a ogni livello di prezzo. Include valori numerici e una mappa di calore visiva per individuare rapidamente chi è aggressivamente in controllo.
- Profilo di Assorbimento (Zone Gialle): Misura il volume intrappolato specificamente all'interno delle ombre delle candele. Questo ti permette di vedere graficamente esattamente dove il denaro intelligente sta assorbendo passivamente la liquidità dai trader retail intrappolati.
- Prestazioni Ottimizzate: I pesanti calcoli volumetrici vengono processati solo sull'ultima candela, garantendo che la tua piattaforma cTrader funzioni in modo fluido ed efficiente, anche su timeframe inferiori.
Come usare questo indicatore nel tuo trading?
Questo indicatore fornisce 3 livelli di conferma per i tuoi trade. Ecco come combinarli efficacemente:
1. Definisci il Contesto con il Profilo di Volume e l'Area di Valore
- Usa il profilo di volume per identificare dove l'accettazione del prezzo è più alta (Area di Valore e POC).
- Strategia: Cerca opportunità di acquisto nella parte bassa dell'Area di Valore (Supporto) e opportunità di vendita nella parte alta dell'Area di Valore (Resistenza).
2. Valuta l'Aggressività con il Profilo Delta
- Quando il prezzo raggiunge il tuo livello chiave (ad esempio, una zona di supporto), guarda la colonna Delta.
- Strategia: Se cerchi un acquisto al supporto, vuoi vedere un Delta fortemente positivo (verde) a quel livello, che indica che gli acquirenti stanno entrando con aggressività. Se il Delta rimane fortemente negativo, i venditori stanno ancora dominando.
3. Trova il Trigger Perfetto con il Profilo di Assorbimento (Il cuore dell'indicatore)
- Qui lo strumento brilla davvero. Spesso, il mercato sembra crollare pesantemente (Delta negativo forte), eppure il prezzo smette di scendere. Perché? Perché le "balene" stanno usando ordini limite per assorbire tutta quella pressione di vendita.
- Strategia (Trade di Inversione): Se vedi il prezzo scendere in un livello critico e il Delta è negativo (venditori retail intrappolati), ma improvvisamente appare una grande barra gialla nel Profilo di Assorbimento, significa che le istituzioni hanno appena assorbito tutta la liquidità in quell'ombra. Questo è il tuo trigger ottimale per entrare nella direzione opposta!
4. Usa il "Filtro di Forza" per Tagliare il Rumore
- Se il mercato è in consolidamento e la direzione non è chiara, attiva l'opzione "Solo Forte". Questo nasconderà tutto il rumore retail irrilevante e ti mostrerà esattamente dove grandi fondi stanno accumulando o distribuendo le loro posizioni.
Riepilogo
A Delta Profile heatmap calculates the net difference between market buys and sells at each price level, showing buyer or seller aggression. The Absorption Profile identifies volume trapped in candlestick wicks, revealing where institutional traders absorb liquidity from retail participants. The indicator’s optimized engine processes heavy volumetric calculations only on the latest candle, ensuring smooth performance on the cTrader platform.
Traders can use this tool to define market context, evaluate buying or selling aggression, and pinpoint reversal triggers based on absorption patterns. The "Strong Only" mode filters out retail noise during consolidation phases, focusing on institutional accumulation or distribution zones. This indicator supports volume and DOM data visualization to enhance decision-making around key support and resistance levels.
Recensioni dei clienti
5 | 100 % | |
4 | 0 % | |
3 | 0 % | |
2 | 0 % | |
1 | 0 % |