
Fixed Range Volume Profile
Indicatore
2 acquisti
Versione 1.0, Jan 2026
Windows, Mac
4.0
Recensioni: 2
Descrizione
Come utilizzare il Fixed Range Volume Profile (FRVP)
- Attiva l'indicatore: Trascina e rilascia il Indicatore FRVP sul grafico desiderato dal menu cTrader Automate o Indicatori.
- Seleziona lo strumento di analisi: Trova lo Strumento di disegno rettangolo standard nella barra degli strumenti di cTrader (tipicamente sul lato destro o sinistro della piattaforma).
- Definisci il tuo intervallo: Clicca e trascina il rettangolo sull'azione del prezzo e sul periodo di tempo specifico che desideri analizzare.
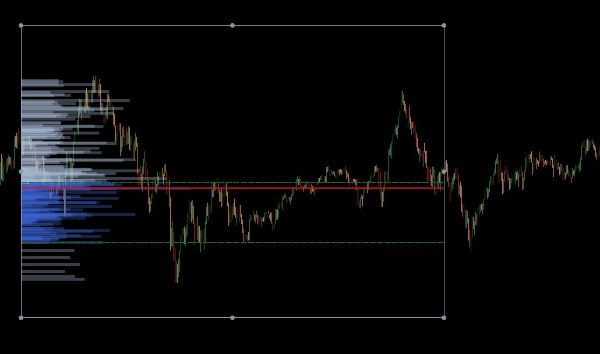
- Inizializza il profilo: Dopo aver disegnato, clicca e sposta leggermente il rettangolo. Questo "scambio di saluto" tra il disegno e l'indicatore attiva il calcolo del volume, generando istantaneamente l'istogramma, il POC e le linee dell'area di valore.
- Regola dinamicamente: Puoi trascinare i bordi del rettangolo per espandere l'intervallo di tempo o spostarlo su una diversa gamba di prezzo; il profilo di volume si ricalcolerà automaticamente per riflettere la nuova area.
Il Fixed Range Volume Profile (FRVP) per cTrader è uno strumento di analisi sofisticato progettato per identificare livelli di prezzo significativi calcolando la distribuzione del volume su un intervallo specifico di tempo e prezzo. A differenza degli indicatori di volume standard che corrispondono al tempo, questo indicatore si concentra sulla densità del prezzo per rivelare il sentimento del mercato.
Caratteristiche principali
- Selezione dinamica dell'intervallo: L'indicatore calcola e aggiorna automaticamente ogni volta che disegni o sposti un rettangolo standard sul tuo grafico cTrader.
- Identificazione dei livelli chiave:
-
- Point of Control (POC): Evidenzia il livello di prezzo con il volume più alto scambiato, agendo come una "calamita" per l'azione del prezzo.
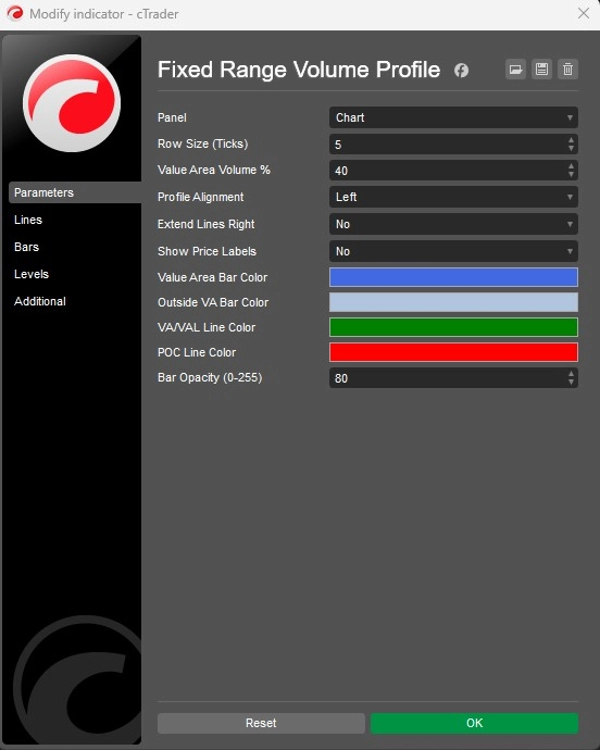
- Value Area High/Low (VAH/VAL): Definisce i confini entro cui è stato scambiato un determinato percentuale di volume (predefinito 40%).
- Layout personalizzabili:
-
- Allineamento: Scegli di visualizzare l'istogramma del volume dal Lato sinistro o dal Lato destro della casella.
- Granularità: Regola la Dimensione della riga (predefinita 5 tick) per controllare il dettaglio delle barre di volume.
- Aspetto visivo: Controllo completo sui colori delle barre (Area di valore vs. Esterno), opacità e visibilità delle etichette di prezzo.
Applicazione strategica
- Supporto e resistenza: I nodi ad alto volume (HVN) spesso agiscono come forti supporti o resistenze, mentre i nodi a basso volume (LVN) rappresentano aree "sottili" dove il prezzo può muoversi rapidamente.
- Conferma del trend: Usa la funzione Estendi a destra per vedere come i livelli di volume storici interagiscono con l'azione del prezzo corrente mentre si sviluppa.
Riepilogo
Profilo indicatore
Recensioni dei clienti
4.0
Recensioni: 2
5 | 0 % | |
4 | 100 % | |
3 | 0 % | |
2 | 0 % | |
1 | 0 % |
Discussioni
Domande frequenti
BTCUSD
Forex
Signal
Breakout
Indices
EURUSD
Commodities
GBPUSD
NZDUSD
Fibonacci
Prop
Scalping
Fair Value Gap
SMC
Crypto
Stocks
XAUUSD
NAS100
USDJPY
VWAP
I prodotti disponibili tramite cTrader Store, inclusi bot di trading, indicatori e plugin, sono forniti da sviluppatori terzi e resi disponibili esclusivamente a scopo informativo e di accesso tecnico. cTrader Store non è un broker e non fornisce consulenze in materia di investimento, raccomandazioni individualizzate o garanzie di risultati futuri.
Altro da questo autore


Prezzo
Da 26/09/2025
13
Vendite