Descrizione
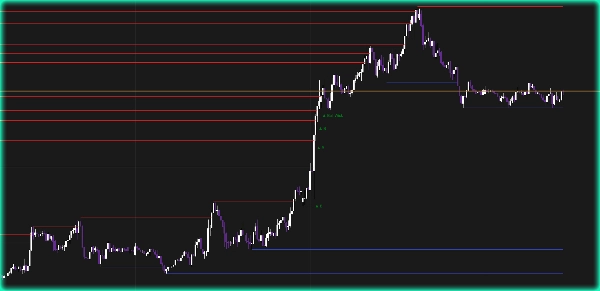
Livelli di Supporto & Resistenza con Rotture di [BeyondTrading] — Vedi ogni livello live e ogni vera rottura. Rileva automaticamente i massimi e minimi pivot e traccia linee orizzontali di supporto e resistenza direttamente sul grafico. Ogni linea si estende barra dopo barra in tempo reale finché il livello regge. Nel momento in cui il prezzo chiude oltre, la linea si ferma — esattamente al punto di contatto. Nessun disegno manuale, nessun livello obsoleto che ingombra il tuo grafico.
Quando un livello viene rotto, appare immediatamente un segnale: B per una rottura pulita con volume, Bull Wick o Bear Wick quando la chiusura è guidata da un'ombra piuttosto che da una vera chiusura del corpo. Il filtro volume elimina i movimenti a bassa convinzione e mantiene solo i segnali che contano.
Perché i livelli S/R sono importanti I livelli di supporto e resistenza non sono solo linee — sono bacini di liquidità. Ogni volta che il prezzo ha respinto un livello, ordini stop e ordini pendenti si accumulano appena sopra e sotto di esso. Quando il prezzo ritorna, le istituzioni intervengono per difendere il livello o per cacciare gli stop posizionati lì prima che inizi il vero movimento. Un livello di resistenza testato tre volte e mai rotto non è casuale — è dove gli ordini di vendita sono accumulati e dove i trader di breakout rimarranno intrappolati se il movimento è falso. Sapere quali livelli sono ancora attivi e quali sono già stati superati ti dice esattamente dove è probabile che avvenga la prossima reazione.
Caratteristiche
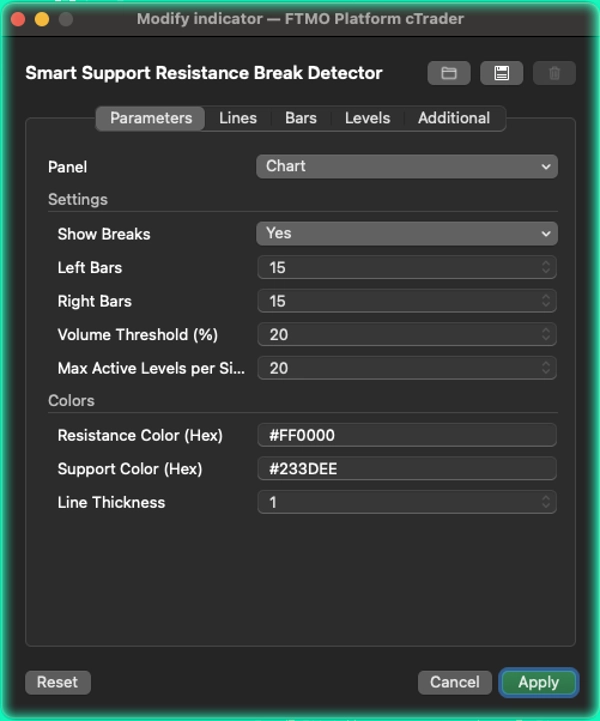
- Rilevamento pivot con barre sinistre e destre configurabili per qualsiasi stile di trading
- Le linee si estendono dinamicamente ad ogni barra — si fermano nel momento in cui il prezzo chiude oltre
- Filtro volume (oscillatore EMA 5/10) per distinguere le vere rotture dal rumore
- Etichette di rottura: B per rotture pulite con volume, Bull Wick e Bear Wick per movimenti guidati dall'ombra
- Filtro duplicati — i livelli troppo vicini a quelli esistenti vengono ignorati automaticamente
- Numero massimo di livelli attivi per lato per mantenere il grafico pulito e leggibile
- Colori di resistenza e supporto completamente configurabili con input esadecimale
Riepilogo
The indicator features volume-confirmed break signals to distinguish genuine breakouts from low-conviction moves. It displays specific labels: "B" for clean volume breaks, and "Bull Wick" or "Bear Wick" when breaks are driven by wicks rather than body closes. A volume filter based on EMA oscillators helps filter out noise.
Additional functionalities include configurable pivot detection parameters (Left Bars and Right Bars), automatic filtering of duplicate levels, and limits on the maximum number of active levels per side to maintain chart clarity. Users can customize support and resistance line colors using hex codes.
This tool is designed to highlight key liquidity pools where institutional orders accumulate, aiding traders in identifying active levels and potential reaction points in the market.