
คำอธิบาย
รายการนี้สรุปการตั้งค่าขั้นสูงและคุณสมบัติของตัวบ่งชี้การซื้อขาย Smart Money Concepts (SMC) ออกแบบมาเพื่อทำให้งานวิเคราะห์ทางเทคนิคของโครงสร้างตลาด อุปสงค์/อุปทาน และสภาพคล่องเป็นไปโดยอัตโนมัติ
นี่คือการสรุปตรงประเด็นเกี่ยวกับสิ่งที่การตั้งค่าเหล่านี้ทำ:
🏗️ โครงสร้างตลาด & การเคลื่อนไหวของราคา
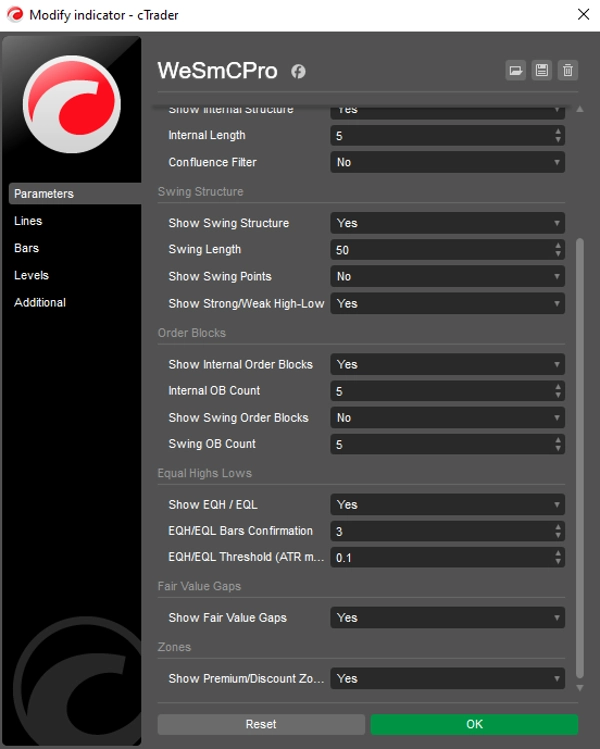
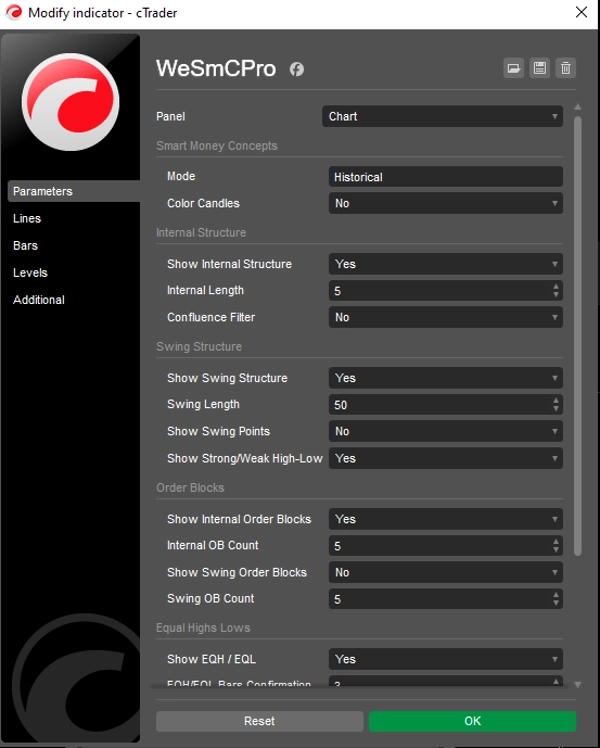
- โหมด (ประวัติ/ปัจจุบัน): เลือกระหว่างการดูข้อมูลทั้งหมดในอดีต (การทดสอบย้อนหลัง) หรือเฉพาะโครงสร้างสดปัจจุบันเพื่อให้แผนภูมิของคุณสะอาด
- โครงสร้างภายในกับโครงสร้างสวิง: * ภายใน: แสดงการแตกหัก "เล็กน้อย" (BOS/CHoCH) ภายในแนวโน้ม
-
- สวิง: แสดงการเปลี่ยนแปลงแนวโน้ม "ใหญ่" โดยใช้เส้นทึบและป้ายชื่อที่ใหญ่กว่า
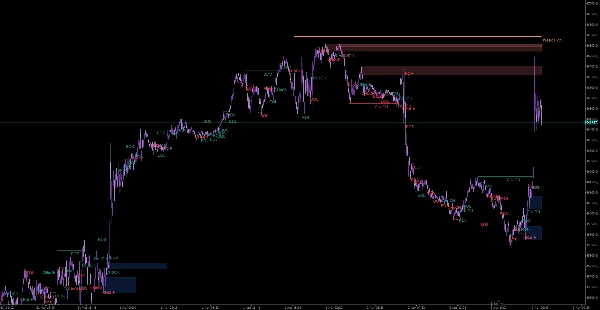
- จุดสวิง: ติดป้ายสูงสุดและต่ำสุดโดยอัตโนมัติ (HH, HL, LH, LL) เพื่อที่คุณจะไม่ต้องระบุแนวโน้มด้วยตนเอง
- ระดับสูง & ต่ำเท่ากัน (EQH/EQL): ระบุจุดสนับสนุน/ต้านทาน "รายย่อย" ที่สภาพคล่องของสถาบันมักจะอยู่ การยืนยันแท่งเทียน ช่วยกรองระดับสูง/ต่ำเทียม
🧱 อุปทาน อุปสงค์ & ความไม่สมดุล
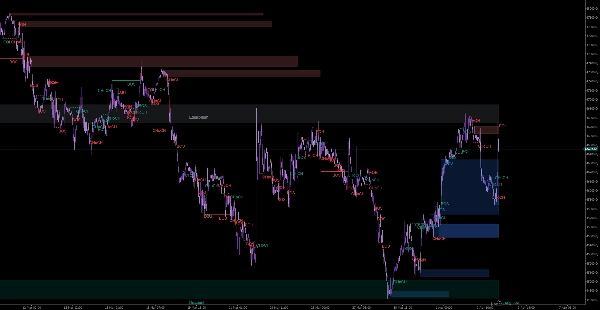
- บล็อกคำสั่ง (ภายใน & สวิง): เน้น "แท่งเทียนสุดท้าย" ก่อนการเคลื่อนไหวครั้งใหญ่ที่สถาบันน่าจะมีคำสั่งพักอยู่ คุณสามารถจำกัดจำนวนที่แสดงเพื่อหลีกเลี่ยงความยุ่งเหยิง
- ช่องว่างมูลค่ายุติธรรม (FVG): เน้นความไม่สมดุลของราคา (ช่องว่าง)
-
- เกณฑ์อัตโนมัติ: กรองช่องว่างเล็ก ๆ ที่ไม่มีนัยสำคัญ
- กรอบเวลา: ให้คุณเห็น FVG จากกรอบเวลาที่สูงกว่าในขณะที่ยังอยู่ในแผนภูมิปัจจุบันของคุณ
- ขยาย FVG: ฉายช่องว่างไปข้างหน้าเพื่อให้คุณเห็นเมื่อราคากลับมาที่ช่องว่างนั้นในที่สุด
📊 บริบท & การรวมกัน
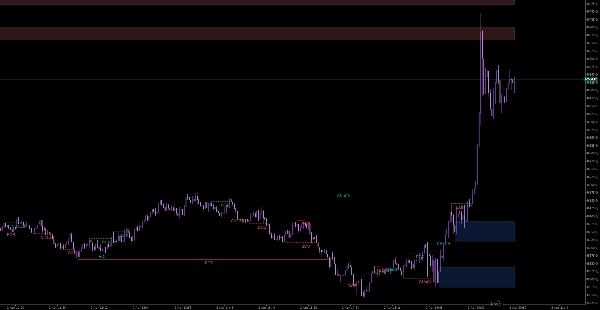
- ระดับสูง & ต่ำ MTF: วางระดับสูง/ต่ำรายวัน รายสัปดาห์ และรายเดือนก่อนหน้า เหล่านี้คือระดับ "แม่เหล็ก" ที่ราคามักจะตอบสนอง
- โซนพรีเมียม/ส่วนลด: แบ่งช่วงการซื้อขายออกเป็นสามส่วน:
-
- พรีเมียม: ราคาสูง (มองหาการขาย)
- สมดุล: มูลค่ายุติธรรม
- ส่วนลด: ราคาถูก (มองหาการซื้อ)
- ตัวกรองการรวมกัน: สวิตช์ "อัจฉริยะ" ที่ซ่อนการแตกหักโครงสร้างที่อ่อนแอ แสดงเฉพาะการเคลื่อนไหวที่มีโมเมนตัมหรือปริมาณสูงเท่านั้น
สรุป
สรุปโดย AI
WeSmCPro is a Smart Money Concepts (SMC) trading indicator designed to automate technical analysis by identifying market structure, supply and demand zones, and liquidity areas. It offers two modes: Historical for backtesting and Present for live market structure visualization. The indicator distinguishes between internal (minor) and swing (major) trend structures, automatically labeling swing points such as higher highs, higher lows, lower highs, and lower lows.
Key features include detection of equal highs and lows to identify potential retail support and resistance zones, with filters to reduce false signals. It highlights order blocks—candles preceding significant moves where institutional orders may rest—and fair value gaps (price imbalances), with options to filter insignificant gaps, view higher timeframe gaps on the current chart, and extend gaps forward for tracking price return.
For broader context, WeSmCPro plots multi-timeframe daily, weekly, and monthly highs and lows, which often act as price magnets. It divides trading ranges into premium (expensive), equilibrium (fair value), and discount (cheap) zones to assist in identifying potential sell or buy areas. A confluence filter helps focus on strong structure breaks supported by momentum or volume. The indicator supports various markets including Forex, cryptocurrencies, indices, commodities, and stocks.
โปรไฟล์อินดิเคเตอร์
รีวิวจากลูกค้า
0.0
รีวิว: 0
รีวิวจากลูกค้า
ยังไม่มีรีวิวสำหรับผลิตภัณฑ์นี้ หากเคยลองแล้ว ขอเชิญมาเป็นคนแรกที่บอกคนอื่น!
การสนทนา
คำถามที่พบบ่อย
BTCUSD
Forex
Signal
Breakout
Indices
EURUSD
Commodities
GBPUSD
NZDUSD
Martingale
Prop
Scalping
SMC
Crypto
Grid
Stocks
AI
XAUUSD
NAS100
USDJPY
ผลิตภัณฑ์ที่มีให้บริการผ่าน cTrader Store รวมถึงบอทการเทรด อินดิเคเตอร์ และปลั๊กอิน มีให้บริการโดยนักพัฒนาบุคคลที่สามและมีไว้เพื่อวัตถุประสงค์ในการเข้าถึงข้อมูลและทางเทคนิคเท่านั้น cTrader Store ไม่ใช่โบรกเกอร์และไม่ได้ให้คำแนะนำการลงทุน คำแนะนำส่วนบุคคล หรือการรับประกันผลการดำเนินงานในอนาคต
เพิ่มเติมจากผู้เขียนคนนี้


ราคา
2.79K
ติดตั้งฟรี