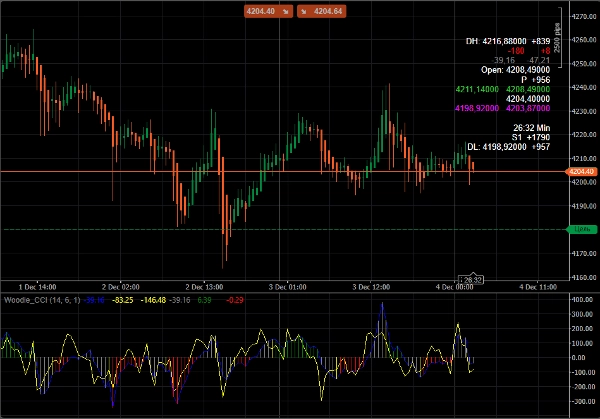
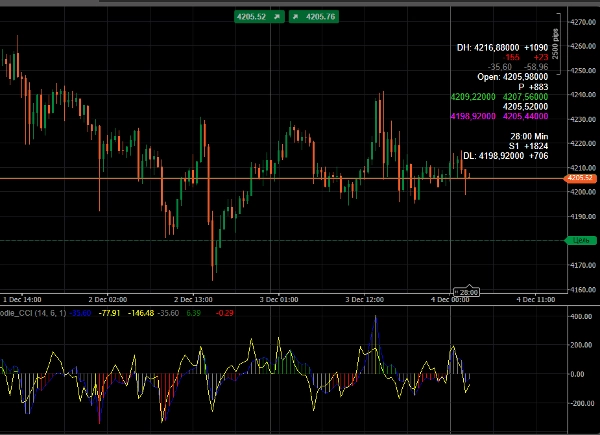
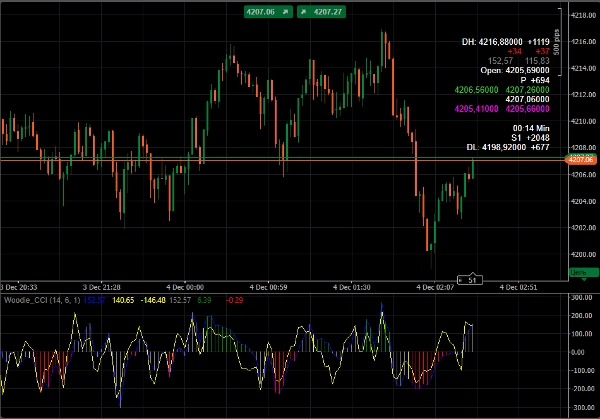
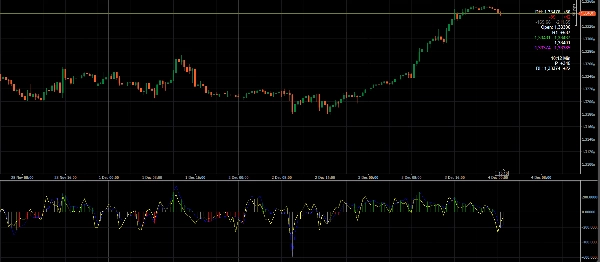
โบรกเกอร์และ Props
สำหรับธุรกิจ
00
Days
:
00
Hours
:
00
Minutes
:
00
Seconds
อินดิเคเตอร์
Indices
XAUUSD
Forex
EURUSD
GBPUSD
Crypto
Scalping
"Woodie_CCI" โลโก้
5.0
04/12/2025
31
Desktop
ตั้งแต่ 24/10/2025
ปริมาณการเทรด
8.26K
Pips ที่ได้กำไร
44
การขาย
1
ติดตั้งฟรี
118
"Woodie_CCI" ภาพที่อัปโหลด"Woodie_CCI" ภาพที่อัปโหลด"Woodie_CCI" ภาพที่อัปโหลด"Woodie_CCI" ภาพที่อัปโหลด

The Woodie CCI Indicator (Woodie Commodity Channel Index) is a variation of the classic CCI indicator created for intraday and trend-tracking trading. It was popularized by trader Ken Wood (Woodie), and it became the basis of the entire Woodie's CCI System trading system.

5.0
รีวิว: 1
5
100 %
4
0 %
3
0 %
2
0 %
1
0 %
รีวิวจากลูกค้า
December 10, 2025
Woodie_CCI offers a clean, modern take on the classic CCI. Two-line structure, trend highlighting, and smooth momentum shifts make it a strong tool for intraday traders. Stable, lightweight and easy to read. Pattern detection and alerts would make it even stronger.
เพิ่มเติมจากผู้เขียนคนนี้
Wave Weis Bar Force - is an indicator that applies the logic of Volume waves (Weis) to determine accumulation
Gann Pivot Vision is an innovative analytical tool that combines classic pivot reversal levels and Gann geometry
SigmaTrend Oscillator
SigmaTrend Oscillator is an advanced momentum-based trend identification tool that combines dynamic price
Woodie_CCI_pro is an advanced CCI-based toolkit built around the classic Woodie CCI methodology.
นอกจากนี้คุณยังอาจชอบ
VegaXLR - cTrader Pitchfork & Channel Enhancer
Enhance Pitchfork & Price Channels in cTrader with customizable Equidistant and Fibonacci levels.
Donchian Flux Cloud
Trend-coloring Donchian cloud that highlights volatility squeezes and breakouts.
Ichimoku Cloud Indicator
The Ichimoku Cloud is a comprehensive technical analysis system developed by Japanese journalist Goichi Hosoda
Matrix Pro by PrimeQuant
Multi-timeframe S/R, SRWMA trend & Demarker pivots with smart alerts—clarity for any market, any timeframe.
The Dark Cloud Cover indicator detects a bearish reversal pattern, marking key candles and confirming signals based on v
[Stellar Strategies] Linear Regression Candles 1.1
Approach to price analysis by visualizing candlestick data through the lens of linear regression slopes 📈📉
RSI + EMA Crossover Signals
Dual confirmation RSI + EMA crossover signals with visual alerts and dynamic ATR offsets.
Automatic Fibonatti
Automatically plots Fibonacci retracement levels using the highest and lowest points of a customizable time range
เรตติ้งสูง
ฟรี
Follow Line
The Follow Line Indicator is a versatile tool designed to identify market trends and provide accurate buy/sell signals.
Fair Value Gap (Extended)
Detect FVGs with age, status, Fibonacci levels, and customizable fill threshold—extended version.
zh-cn Variety Period clock panel(multilanguage)
This indicator can be used to: change color, shape size, position, change font, increase or decrease, and other function
TwoSMA PRO
TwoSMA indicator detects trend via SMA crossover, filters flat markets with ATR, and provides clear BUY and SELL signals