
Mô tả
Giới thiệu chỉ báo QQE (Đánh giá Định tính Định lượng) nâng cao, một công cụ mạnh mẽ kết hợp hai chỉ báo QQE để có cái nhìn sâu sắc hơn về giao dịch.
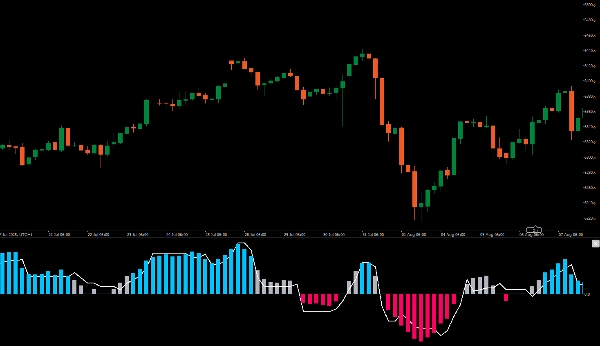
Một QQE được hiển thị trên biểu đồ dưới dạng các cột, trong khi cái còn lại hoạt động ở nền với dải Bollinger 50 kỳ đóng vai trò như đường số không.
Cài đặt này cho phép bạn đánh giá trực quan động lượng thị trường và xác định các điểm vào tiềm năng một cách rõ ràng. Khi cả hai chỉ báo QQE đồng thuận, bạn sẽ thấy các thanh màu xanh hoặc đỏ rõ ràng, báo hiệu cơ hội mua hoặc bán mạnh.
Nâng cao chiến lược giao dịch của bạn với chỉ báo QQE để có các quyết định thông minh hơn và cải thiện độ chính xác trong phân tích thị trường của bạn.Giới thiệu chỉ báo QQE (Đánh giá Định tính Định lượng) nâng cao, một công cụ mạnh mẽ kết hợp hai chỉ báo QQE để có cái nhìn sâu sắc hơn về giao dịch.
Một QQE được hiển thị trên biểu đồ dưới dạng các cột, trong khi cái còn lại hoạt động ở nền với dải Bollinger 50 kỳ đóng vai trò như đường số không.
Cài đặt này cho phép bạn đánh giá trực quan động lượng thị trường và xác định các điểm vào tiềm năng một cách rõ ràng. Khi cả hai chỉ báo QQE đồng thuận, bạn sẽ thấy các thanh màu xanh hoặc đỏ rõ ràng, báo hiệu cơ hội mua hoặc bán mạnh.
Nâng cao chiến lược giao dịch của bạn với chỉ báo QQE để có các quyết định thông minh hơn và cải thiện độ chính xác trong phân tích thị trường của bạn.
Tóm tắt
Đánh giá của khách hàng
5 | 100 % | |
4 | 0 % | |
3 | 0 % | |
2 | 0 % | |
1 | 0 % |


