
คำอธิบาย
ตัวบ่งชี้แผนภาพ Wyckoff เป็นเครื่องมือโครงสร้างตลาดระดับมืออาชีพที่ออกแบบมาเพื่อตรวจจับและแสดงภาพ ช่วงสะสมและแจกจ่ายของ Wyckoff โดยตรงบนแผนภูมิ
สร้างขึ้นบนหลักการของ วิธีการ Wyckoff ตัวบ่งชี้นี้ระบุเหตุการณ์สถาบันสำคัญ เช่น Selling Climax (SC), Automatic Rally (AR), Spring, Sign of Strength (SOS), Buying Climax (BC), Upthrust (UTAD) และอื่นๆ—ช่วยให้นักเทรดเข้าใจ พฤติกรรมเงินฉลาด แบบเรียลไทม์
แตกต่างจากตัวบ่งชี้แบบดั้งเดิม เครื่องมือนี้ไม่พึ่งพาสัญญาณที่ล่าช้า แต่เน้นที่ โครงสร้างราคา, พฤติกรรมปริมาณ และความผันผวน ซึ่งให้ข้อมูลเชิงลึกที่ลึกซึ้งยิ่งขึ้นเกี่ยวกับพลวัตของตลาด
แนวคิดหลัก
ตัวบ่งชี้นี้อิงจากแนวคิดที่ว่าตลาดเคลื่อนที่ผ่านวงจรที่มีโครงสร้าง:
- สะสม → ขึ้นราคา → แจกจ่าย → ลงราคา
มันตรวจจับและแสดงภาพโดยอัตโนมัติ:
- ช่วง ตลาด
- ช่วงของ Wyckoff (A–E)
- เหตุการณ์ สถาบันสำคัญ
- การเบรกเอาต์และการหลอกลวงโครงสร้าง
คุณสมบัติหลัก
1. การตรวจจับช่วง Wyckoff อัตโนมัติ
ตัวบ่งชี้ระบุช่วงหลักทั้งหมดของวงจร Wyckoff:
- ช่วง A – หยุดแนวโน้ม
- ช่วง B – สร้างสาเหตุ (การก่อตัวของช่วง)
- ช่วง C – Spring / UTAD (เบรกเอาต์ปลอม)
- ช่วง D – ยืนยันแนวโน้ม (SOS / SOW)
- ช่วง E – ต่อเนื่องแนวโน้ม
แต่ละช่วงจะถูกเน้นด้วยสีที่ปรับแต่งได้เพื่อการจดจำทันที
2. การจดจำเหตุการณ์อัจฉริยะ
ระบบตรวจจับเหตุการณ์ Wyckoff สำคัญ:
ช่วงสะสม:
- SC – Selling Climax
- AR – Automatic Rally
- ST – Secondary Test
- Spring – False breakdown
- SOS – Sign of Strength
- LPS – Last Point of Support
ช่วงแจกจ่าย:
- BC – Buying Climax
- AR – Automatic Reaction
- ST – Secondary Test
- UTAD – Upthrust After Distribution
- SOW – Sign of Weakness
- LPSY – Last Point of Supply
เหตุการณ์เหล่านี้ถูกวางบนแผนภูมิโดยตรงพร้อมป้ายกำกับ
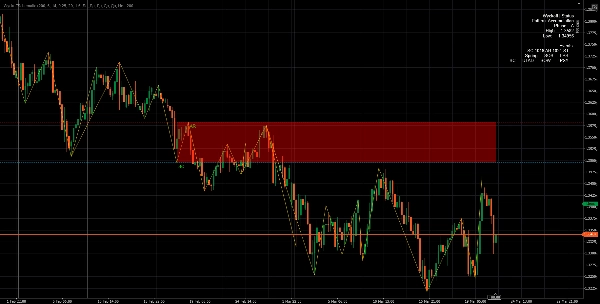
3. การตรวจจับช่วงแบบปรับตัว
ตัวบ่งชี้สร้างและอัปเดตช่วงการซื้อขายอย่างไดนามิก:
- ตรวจจับโดยอัตโนมัติ จุดสูงและต่ำของช่วง
- ปรับขอบเขตโดยใช้ ความทนทานตาม ATR
- แสดง โซนแนวรับและแนวต้าน
สิ่งนี้ช่วยให้นักเทรดเห็นอย่างชัดเจนว่าตลาดกำลังสะสมหรือแจกจ่ายที่ใด
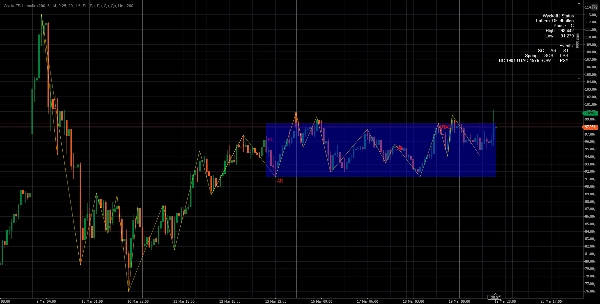
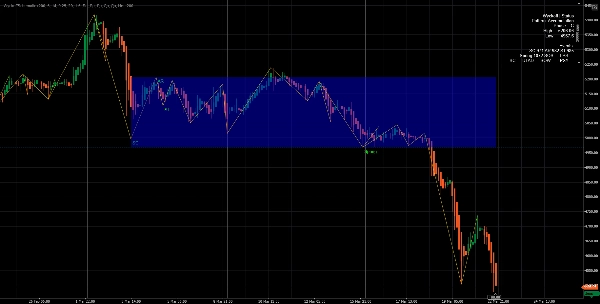
4. เครื่องยนต์โครงสร้าง ZigZag
ระบบ ZigZag แบบพึ่งพาจุดหมุน ในตัว:
- กรองเสียงรบกวนของตลาด
- เน้นจุดสูงและต่ำของโครงสร้างที่แท้จริง
- รับประกันการจดจำรูปแบบที่แม่นยำ
สิ่งนี้จำเป็นสำหรับการระบุโครงสร้าง Wyckoff อย่างน่าเชื่อถือ
5. การรวมปริมาณและความผันผวน
ตัวบ่งชี้ใช้:
- ค่าเฉลี่ยเคลื่อนที่ของปริมาณ
- การตรวจจับปริมาณพุ่งสูง
- ATR (ช่วงจริงเฉลี่ย)
สิ่งนี้ช่วยให้สามารถ:
- ยืนยัน กิจกรรมสถาบัน
- กรองสัญญาณเท็จ
- ปรับปรุงความแม่นยำของเหตุการณ์เช่น SC, BC, Spring, UTAD
6. ตรรกะเครื่องสถานะแบบเรียลไทม์
ที่แกนกลาง ตัวบ่งชี้ทำงานด้วย อัลกอริทึมเครื่องสถานะ ที่:
- ติดตามวิวัฒนาการโครงสร้างตลาด
- เปลี่ยนผ่านระหว่างช่วง (A → E)
- ป้องกันสัญญาณซ้ำซ้อน
- รักษาบริบท (สะสมกับแจกจ่าย)
7. ส่วนประกอบภาพ
ตัวบ่งชี้มีชุดเครื่องมือภาพเต็มรูปแบบ:
- ✔ กล่องเน้นช่วง
- ✔ เส้นสูง/ต่ำของช่วง
- ✔ เส้นโครงสร้าง ZigZag
- ✔ ป้ายเหตุการณ์บนแผนภูมิ
- ✔ แผงสถานะแบบเรียลไทม์
8. แผงสถานะ (ข้อมูลตลาดสด)
แผงในตัวแสดง:
- รูปแบบ ปัจจุบัน (สะสม / แจกจ่าย)
- ช่วง ปัจจุบัน (A–E)
- ขอบเขตของช่วง
- เหตุการณ์ที่ตรวจพบ
สิ่งนี้ให้ภาพรวมทันทีของสภาพตลาดแก่นักเทรด
9. ระบบแจ้งเตือน
ตัวเลือก แจ้งเตือนป๊อปอัป แจ้งเตือนเมื่อเกิดเหตุการณ์สำคัญ:
- SC, BC, Spring, UTAD, SOS, SOW, ฯลฯ
เหมาะสำหรับการติดตามหลายตลาด
ข้อดี
✔ มุมมองเงินฉลาด
แตกต่างจากตัวบ่งชี้ทั่วไป เครื่องมือนี้ปฏิบัติตาม ตรรกะของสถาบัน ไม่ใช่ตัวบ่งชี้สำหรับรายย่อย
✔ การตรวจจับสัญญาณล่วงหน้า
ระบุ การสะสม/แจกจ่ายก่อนการเบรกเอาต์ ช่วยให้:
- การเข้าตลาดล่วงหน้า
- การตั้งค่าความเสี่ยง/ผลตอบแทนที่ดีขึ้น
✔ การลดเสียงรบกวน
โดยใช้จุดหมุน, ATR และตัวกรองปริมาณ ตัวบ่งชี้หลีกเลี่ยง:
- สัญญาณสุ่ม
- เสียงรบกวนของตลาด
- การเบรกเอาต์ปลอม
✔ การวิเคราะห์ Wyckoff อัตโนมัติเต็มรูปแบบ
ไม่จำเป็นต้องทำเครื่องหมายด้วยตนเอง:
- ช่วง
- เหตุการณ์
- ช่วงตลาด
ทุกอย่างถูกตรวจจับโดยอัตโนมัติ
✔ ปรับแต่งได้สูง
คุณสามารถปรับ:
- ช่วงเวลาย้อนหลัง
- ความไวของจุดหมุน
- ความทนทานของ ATR
- ความไวของปริมาณ
- องค์ประกอบภาพ (ป้าย, กล่อง, เส้น)
✔ ปรับประสิทธิภาพสูง
- ใช้การวิเคราะห์หน้าต่างเลื่อน
- จำกัดวัตถุวาด
- มีประสิทธิภาพสำหรับการซื้อขายแบบเรียลไทม์
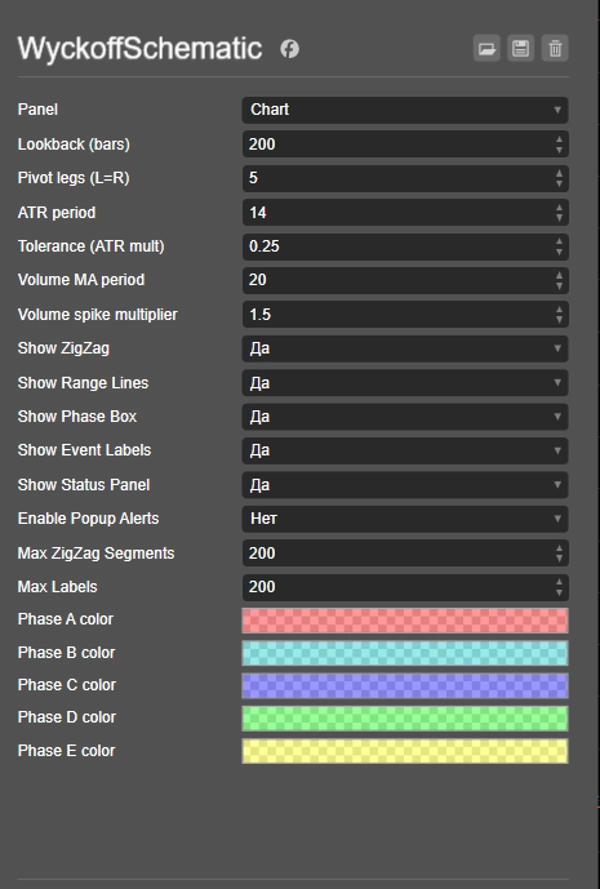
พารามิเตอร์นำเข้า
โครงสร้างและความไว
- แท่งย้อนหลัง – ช่วงการวิเคราะห์
- ขา Pivot – ความไวการตรวจจับสวิง
ความผันผวนและความทนทาน
- ช่วง ATR
- ตัวคูณ ATR (ความทนทาน)
การวิเคราะห์ปริมาณ
- ช่วง MA ปริมาณ
- ตัวคูณปริมาณพุ่งสูง
การแสดงผล
- แสดง ZigZag
- แสดงเส้นช่วง
- แสดงกล่องช่วง
- แสดงป้ายเหตุการณ์
- แสดงแผงสถานะ
การแจ้งเตือน
- เปิดใช้งานการแจ้งเตือนป๊อปอัป
วิธีการทำงาน (แบบง่าย)
- ตรวจจับจุดสูง/ต่ำของ Pivot (โครงสร้างตลาด)
- กำหนดบริบทแนวโน้ม (แนวโน้มขาขึ้น / ขาลง)
- ค้นหาปริมาณพุ่งสูง + เงื่อนไขโครงสร้าง
- เริ่มต้นรูปแบบ Wyckoff (สะสม/แจกจ่าย)
- ติดตามเหตุการณ์และช่วงทีละขั้นตอน
- อัปเดตภาพแผนภูมิแบบเรียลไทม์
กรณีการใช้งานที่ดีที่สุด
- การเทรดเงินฉลาด / Wyckoff
- การเทรดเบรกเอาต์
- การเทรดช่วง
- การตรวจจับการกลับตัว
- การวิเคราะห์การไหลของคำสั่งสถาบัน
บทสรุป
ตัวบ่งชี้ Wyckoff Schematic Indicator เป็นเครื่องมือวิเคราะห์ที่ทรงพลังซึ่งเปลี่ยนทฤษฎี Wyckoff ที่ซับซ้อนให้กลายเป็น ระบบการซื้อขายที่อัตโนมัติเต็มรูปแบบ, มีภาพ และใช้งานได้จริง.
ช่วยให้นักเทรดสามารถ:
- เข้าใจ เจตนาตลาด
- ระบุ การตั้งค่าที่มีความน่าจะเป็นสูง
- เทรดให้สอดคล้องกับ พฤติกรรมของสถาบัน
สรุป
รีวิวจากลูกค้า
5 | 100 % | |
4 | 0 % | |
3 | 0 % | |
2 | 0 % | |
1 | 0 % |


