
Açıklama
Woodie_CCI_pro, klasik Woodie CCI metodolojisi etrafında oluşturulmuş gelişmiş bir CCI tabanlı araç setidir.
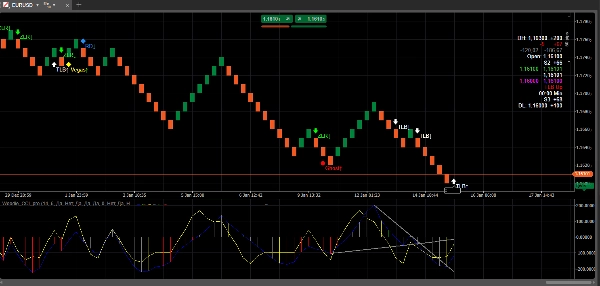
Yumuşatma ile Woodie tarzı bir CCI çizer ve en önemli Woodie desenlerini net grafik üzeri sinyaller, isteğe bağlı osilatör işaretçileri ve isteğe bağlı TLB trend çizgisi rehberliği ile CCI paneli içinde daha iyi bağlam ve daha hızlı karar verme için vurgular.
Tasarımı temiz tarihsel görünürlük içindir: tüm sinyaller geçmişte çizilir, etiketler tam desen adını gösterir ve trend çizgisi çizimi ölçek bozulmasını ve “çizgi artefaktlarını” önlemek için optimize edilmiştir.
Temel Özellikler
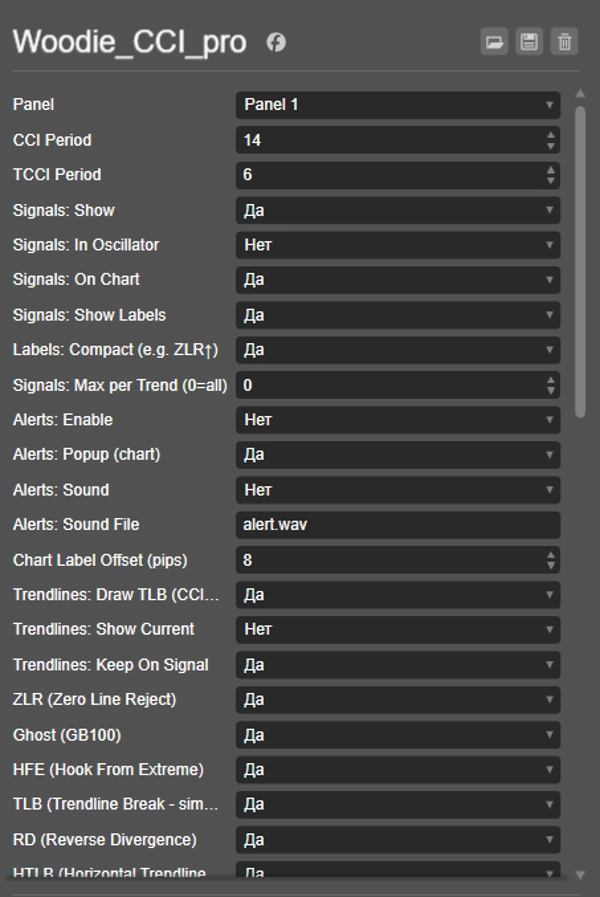
1) Woodie Desen Tespiti (Otomatik Sinyaller)
Woodie_CCI_pro aşağıdaki Woodie desenlerini tespit eder ve etiketler:
- ZLR (Sıfır Çizgisi Reddetme)
- Ghost
- HFE (Uçtan Kanca)
- TLB (Trend Çizgisi Kırılması)
- HTLB (Yatay Trend Çizgisi Kırılması)
- RD (Ters Uyumsuzluk)
- Famir
- Vegas Trade (VT)
Her sinyal, yön farkındalığı olan işaretçiler (Yukarı/Aşağı) ve bir etiketle (örneğin, ZLR↑, TLB↓) çizilir, böylece hangi sinyalin tetiklendiğini tam olarak her zaman bilirsiniz.
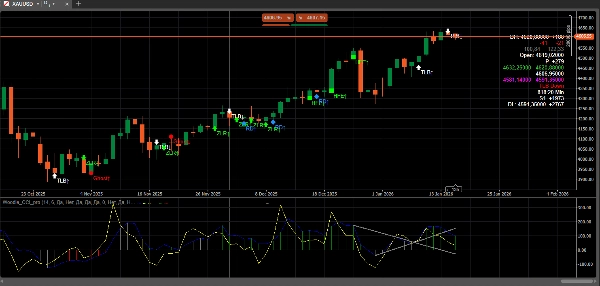
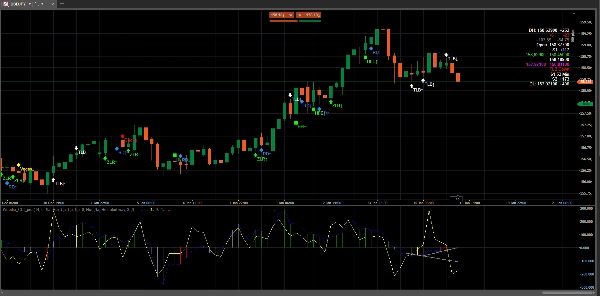
2) Sinyaller Doğrudan Fiyat Grafiğinde
Sinyaller, geçmiş ve canlı kurulumları incelerken maksimum netlik için oklar/simgeler ve metin etiketleri olarak fiyat grafiğinde gösterilir.
Seçenekler şunları içerir:
- grafik üzeri sinyalleri göster/gizle
- etiketleri göster/gizle
- kompakt etiket formatı (örnek:
RD↑) - temiz yerleşim için pip cinsinden etiket/işaretçi kaydırması
3) İsteğe Bağlı Osilatör İşaretçileri
Klasik Woodie hissini tercih ederseniz, isteğe bağlı olarak CCI paneli içinde sinyal işaretçilerini (noktalar/dotlar) etkinleştirebilirsiniz.
Bu tamamen isteğe bağlıdır, böylece sadece grafik seviyesi sinyalleri istediğinizde osilatör temiz kalır.
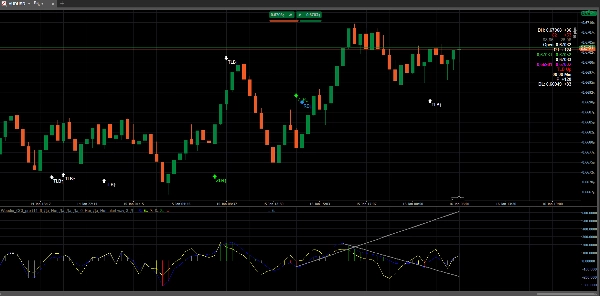
4) CCI Panelinde TLB Trend Çizgisi Rehberliği (Ölçek Sorunu Yok)
Daha iyi yapı tanıma için, gösterge CCI paneli içinde TLB trend çizgileri çizebilir:
- Mevcut TLB çizgileri (en son salınım-salınım rehberliği)
- Keep On Signal seçeneği, bir kırılma anında kullanılan trend çizgisini daha sonra incelemek üzere korur
Çizim, geçmişte temiz kalacak ve “kenar” artefaktları veya zorunlu ölçeklendirmeyi önleyecek şekilde tasarlanmıştır.
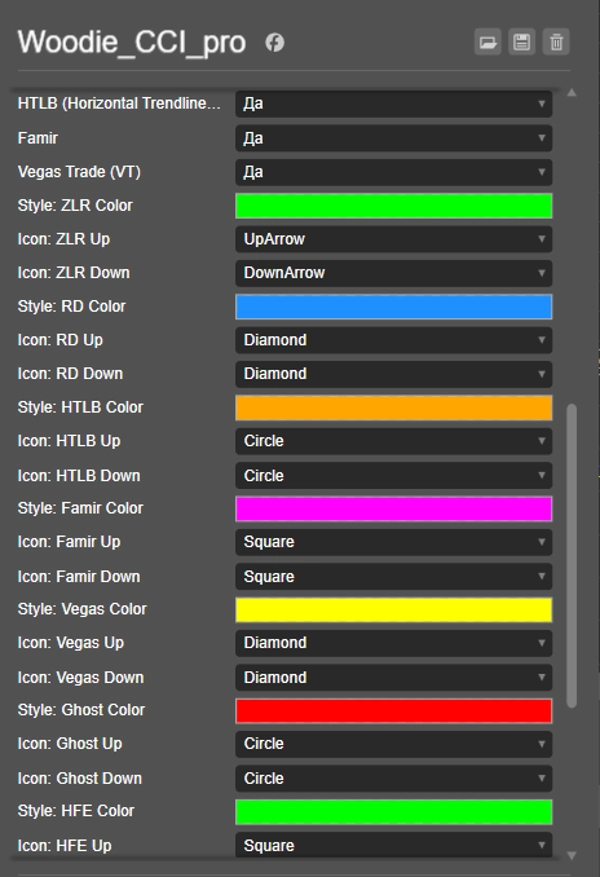
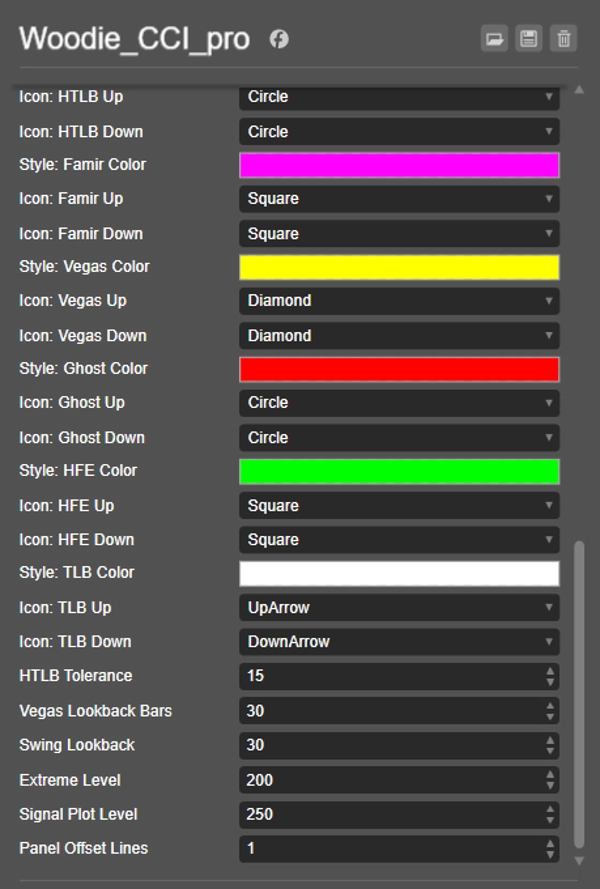
5) Stil ve Görselleştirme Kontrolleri (Desen Bazında)
Görsel görünümü desen bazında özelleştirebilirsiniz:
- Yukarı/Aşağı için simge türü
- desen başına renk (desteklenen yerlerde)
- kompakt veya tam etiketler
6) Uyarılar (İsteğe Bağlı)
Seçilen sinyaller için uyarıları etkinleştirin:
- grafik üzeri açılır pencere tarzı mesaj
- isteğe bağlı ses bildirimi (platform ayarlarınıza bağlı olarak destekleniyorsa)
7) “Trend Başına Maksimum Sinyal” Filtresi (İsteğe Bağlı)
Gürültüyü azaltmak için, trend başına sinyal sayısını sınırlayabilirsiniz:
Trend Başına Maksimum (0 = sınırsız)- sadece mevcut trendle uyumlu sinyalleri sayar (TCCI işaretine göre)
Tipik İş Akışı
- Bir grafiğe Woodie_CCI_pro ekleyin.
- Hızlıca desen davranışını incelemek için Grafik Üzeri Sinyaller ve Etiketler etkinleştirin.
- Kırılmalar ve devam işlemleri için yapısal bağlam istiyorsanız TLB trend çizgilerini açın.
- Klasik Woodie-dot onayını tercih ediyorsanız isteğe bağlı olarak Osilatör İşaretçilerini etkinleştirin.
Notlar ve Felsefe
- Bu gösterge, “aşırı uyumlu” olmaktan çok pratik ve okunabilir olmayı hedefler.
- Bazı desenler (özellikle TLB/HTLB/RD/Vegas gibi çizgi tabanlı olanlar) ayarlanabilir toleranslar/geri bakışlar içerir çünkü piyasa yapısı semboller/zaman dilimleri arasında farklılık gösterir.
- Görsel çıktı, temiz geçmiş, stabil ölçeklendirme ve minimum karmaşa için optimize edilmiştir.
Özet
Müşteri değerlendirmeleri
5 | 50 % | |
4 | 50 % | |
3 | 0 % | |
2 | 0 % | |
1 | 0 % |


