
VA Footprint
Gösterge
2 satın almalar
Sürüm 2.0, May 2026
Windows, Mac
4.5
Değerlendirmeler: 4
Açıklama
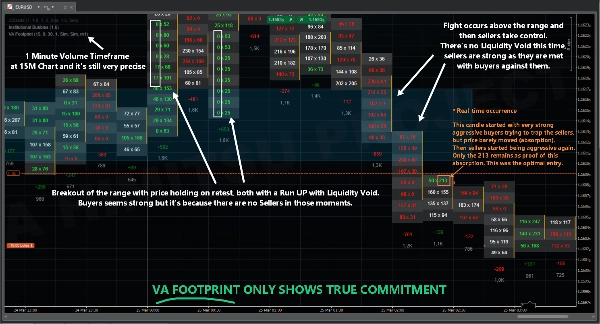
VA Footprint, agresyonu tick kümeleriyle gruplandırarak seviyeler arasında çapraz referans ihtiyacını ortadan kaldırır. Bu yapı ayrıca HFT sahtekarlığına karşı dayanıklılık sağlar (örneğin, niyeti bid x ask seviyesinde gizlemeyi amaçlayan yıkama işlemi veya gürültüye karışmış agresif emirler gibi). 10 tick veya daha fazla kümeler üzerindeki taahhüdü ölçtüğü için, kurumsal faaliyetlerin ayak izlerini gizlemesi zor ve maliyetlidir.
Ayarlanabilir Parametreler (İlgili Ayarlar)
- Kutu Süresi (dakika) --> Grafik zaman aralığınıza uyacak şekilde ayarlayın
- Seviye Boyutu (%)
- Karanlık Mod (true/false)
- Değer Alanını Göster (true/false)
- Hacim Zaman Aralığı (10-tick,50-tick)
Önemli Hususlar
- Tick hassasiyeti ile PİYASA TEKRARI çalışır, stratejinizi geriye dönük test etmek ve göstergiyi daha uzun süreler için test etmek için bunu kullanabilirsiniz.
- Tick Seviyesini artırmak hassasiyeti artırır, çok fazla azaltmak doğruluğu düşürür, en azından 0.10 önerilir.
Özet
YZ özeti
VA Footprint is an order flow indicator that replaces traditional charts with a detailed footprint view, enabling precise market reading. It groups aggressive trading activity by clusters of ticks (typically 10 or more), reducing the need to cross-reference price levels and providing resilience against high-frequency trading spoofing tactics such as wash trading or disguised aggressive orders. This clustering approach makes it difficult for institutional activity to conceal their market footprints.
Key adjustable parameters include box duration (to align with chart timeframe), level size percentage, dark mode toggle, value area display, and volume timeframe selection (e.g., 10-tick or 50-tick clusters). The indicator supports market replay with tick precision, allowing users to backtest strategies over extended periods.
VA Footprint is applicable across multiple markets including Forex, indices, and stocks, and supports trading strategies such as scalping and smart money concepts. It provides visualizations, signals for divergences, breakouts, reversals, trend strength, volatility regimes, and level breaks, relying on tick data, bars, and volume inputs. This tool is designed to enhance market structure analysis and order flow understanding for traders.
Gösterge profili
Gösterge kategorisi
Emir akışı / Piyasa derinliği
Çıktı türü
Görselleştirme
Sinyaller
Filtre
Veri gereklilikleri
Tick verisi
Yalnızca çubuklar
Hacim
Desteklenen sinyaller
Sapma
Kırılma
Yön değiştirme
Trend gücü
Volatilite
Seviye kırılması
Müşteri değerlendirmeleri
4.5
Değerlendirmeler: 4
5 | 50 % | |
4 | 50 % | |
3 | 0 % | |
2 | 0 % | |
1 | 0 % |
Müşteri değerlendirmeleri
April 10, 2026
A decent setup here should survive 1 percent risk without looking messy. The first month should show both ROI and DD. The next review on it on 30 trades.
April 4, 2026
For risk management, this feels more useful as a filter than a full system. The journal should cover 76 setups and the trade context.
April 4, 2026
The stats tell the story. Tracking 1 percent risk first, compare the result with BE after 1R, and only scale if 1.5R partials still looks controlled.
March 31, 2026
Feels right for a user who wants less noise in the process. The best use is sizing and stop planning, then leaving the final filter manual. The problem appears when the tool makes weak ideas look acceptable.5R partials.
Tartışma
SSS
Prop
Forex
Scalping
Indices
SMC
Stocks
Market Structure
cTrader Store üzerinden erişilebilen işlem botları, göstergeler ve eklentiler gibi ürünler, üçüncü taraf sağlayıcılar tarafından sağlanır ve yalnızca bilgilendirme ve teknik erişim amaçlarıyla sunulur. cTrader Store bir broker değildir ve yatırım tavsiyesi, kişisel öneriler vermez veya gelecekteki performansı garanti etmez.
Bu oluşturanın diğer ürünleri


Fiyat
Başlangıç 24/03/2026
10
Satışlar
64
Ücretsiz yüklemeler