

MACD Based Price Forecasting
مؤشر
الإصدار 1.0، Jul 2026
Windows, Mac

534.4M
حجم التداول
9.76M
الربح بالبيب
4
المبيعات
الوصف
التنبؤ بالسعر بناءً على MACD
نظرة عامة
يتجاوز هذا المؤشر حدود MACD التقليدي من خلال الانتقال إلى ما بعد التحليل التاريخي، مقدمًا بشكل مبتكر الذاكرة التاريخية والخوارزميات الإحصائية لتوقع حركة السعر المستقبلية.
الآليات الأساسية:
- ذاكرة الاتجاه التاريخي: يسجل المؤشر إزاحة السعر لاتجاهات MACD السابقة (الصعودية والهبوطية) بالنسبة لنقاط بدايتها، مبنيًا قاعدة بيانات إحصائية تصل إلى 50 اتجاهًا حديثًا.
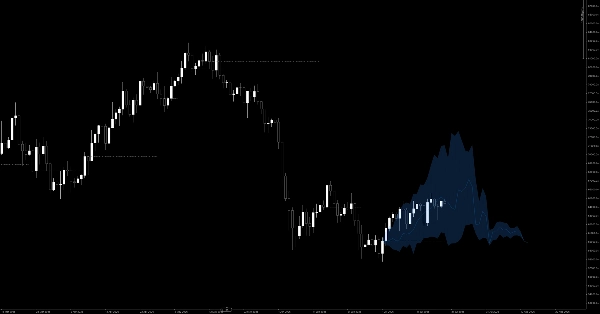
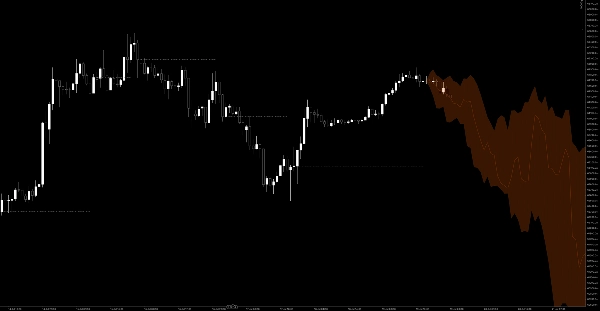
- مروحة التنبؤ الاحتمالي: عند حدوث تقاطع MACD جديد (سواء عبور خط الصفر أو خط الإشارة)، يسترجع المؤشر البيانات من الذاكرة التاريخية. يحسب النسب المئوية 20%، 50%، و80% لتغيرات السعر ويعرض مروحة تنبؤ احتمالية للـ 100 شريط القادمة على الجانب الأيمن من الرسم البياني.
- سحابة منطقة الإشارة الديناميكية: تحدد "سعر المرجع" حيث بدأ انعكاس الاتجاه. عندما يكون السعر الفعلي أعلى من سعر المرجع في اتجاه صاعد، ترسم سحابة خضراء؛ وبالعكس، ترسم سحابة حمراء في اتجاه هابط. هذا يوفر تأكيدًا بصريًا فوريًا على الزخم الصعودي أو الهبوطي الفعلي.
(ملاحظة: يتميز هذا المؤشر برسم بياني محسن للغاية، يستخدم دمج متعدد الأضلاع بسلاسة لمناطق بصرية واضحة وخط مرجعي متقطع مصقول لتجربة رسم بياني نظيفة للغاية.)
قواعد التداول ودليل المستخدم
يتجاوز هذا المؤشر إشارات "الشراء/البيع عند التقاطع" البسيطة—يوفر لك خريطة طريق احتمالية لتداولاتك.
1. إيجاد نقاط الدخول (تأكيد الاتجاه)
- دخولات شراء: عند حدوث تقاطع MACD صعودي، ستظهر مروحة تنبؤ زرقاء تتجه للأعلى على اليمين. لا تتسرع في الدخول. انتظر لترى إذا استقر السعر فوق الخط المنقط-النقطي (سعر المرجع) وبدأت سحابة صعودية خضراء في التوسع. هذا يؤكد أن الزخم الحالي يتوافق مع الإحصائيات التاريخية الصعودية، مما يوفر فرصة قوية لشراء الهبوط.
- دخولات بيع: عند حدوث تقاطع MACD هبوطي، ستظهر مروحة تنبؤ برتقالية تتجه للأسفل على اليمين. ابحث عن بقاء السعر تحت خط المرجع مع توسع سحابة هبوطية حمراء لتأكيد دخول بيع عند ارتداد.
2. تحديد أهداف جني الأرباح
تعمل مروحة التنبؤ كدليل ديناميكي ممتاز لجني الأرباح:
- الهدف 1 (الخط الأوسط): يمثل الخط الأوسط داخل المروحة النسبة المئوية التاريخية 50% (المسار المتوسط). عندما يلمس السعر هذا الخط، يعني أن الحركة الحالية حققت المتوسط التاريخي، مما يجعله موقعًا مثاليًا لجني أرباح جزئية.
- الهدف 2 (حواف المروحة الخارجية): الحد الأعلى (النسبة المئوية 80%) أو الحد الأدنى (النسبة المئوية 20%) يمثلان الحدود التاريخية القصوى. إذا وصل السعر إلى هذه الحواف، يكون الزخم مستنفدًا بشدة، ومن المحتمل جدًا حدوث انعكاس أو ارتداد عميق. فكر في إغلاق المركز بالكامل.
3. وضع وقف خسارة علمي
- يعمل الخط الرمادي المنقط (سعر المرجع) كخط أساس لكل اتجاه.
- عند الدخول شراء، ضع وقف الخسارة قليلاً تحت هذا الخط الرمادي. إذا انخفض السعر دون سعر المرجع واختفت السحابة الخضراء، فهذا يعني أن حركة السعر الفعلية أبطلت الاحتمالية الصعودية التاريخية. فشل إعداد الاتجاه ويجب عليك قطع خسائرك فورًا.
4. فلتر السوق الجانبي
- إذا حدث تقاطع MACD لكن مروحة التنبؤ المتوقعة ظهرت مسطحة جدًا أو منقبضة، فهذا يعني أنه تاريخيًا، أدت تقاطعات مماثلة إلى حركة متقطعة وجانبية فقط.
- عندما ترى مروحة مسطحة، لا تتخذ أي إجراء وتجنب التداول. انتظر الدورة التالية حيث تظهر المروحة توسعًا واضحًا للأعلى أو للأسفل.
الملخص
AI summary
MACD Based Price Forecasting is a technical indicator that extends traditional MACD analysis by incorporating historical memory and statistical algorithms to predict future price movements. It records price displacements from up to 50 recent MACD trends, both bullish and bearish, creating a statistical database for forecasting.
Key features include a probability forecasting fan that projects 20%, 50%, and 80% price change percentiles for the next 100 bars following a MACD crossover. The indicator visually displays this fan on the chart, with blue fans for bullish signals and orange for bearish. A dynamic signal area cloud highlights momentum: green for confirmed uptrends above a reference price and red for downtrends below it.
Trading guidance involves waiting for price confirmation above or below the reference price and cloud before entering long or short positions. The forecasting fan also serves as a dynamic take-profit guide, with the middle line representing average historical moves and outer edges indicating potential trend exhaustion. Stop-loss placement is recommended just beyond the reference price line to manage risk.
Additionally, the indicator filters ranging markets by identifying flat or contracted fans, signaling sideways price action and advising traders to avoid entering trades during such periods. The indicator supports visualization outputs and is tagged under MACD and momentum indicators.
Key features include a probability forecasting fan that projects 20%, 50%, and 80% price change percentiles for the next 100 bars following a MACD crossover. The indicator visually displays this fan on the chart, with blue fans for bullish signals and orange for bearish. A dynamic signal area cloud highlights momentum: green for confirmed uptrends above a reference price and red for downtrends below it.
Trading guidance involves waiting for price confirmation above or below the reference price and cloud before entering long or short positions. The forecasting fan also serves as a dynamic take-profit guide, with the middle line representing average historical moves and outer edges indicating potential trend exhaustion. Stop-loss placement is recommended just beyond the reference price line to manage risk.
Additionally, the indicator filters ranging markets by identifying flat or contracted fans, signaling sideways price action and advising traders to avoid entering trades during such periods. The indicator supports visualization outputs and is tagged under MACD and momentum indicators.
ملف تعريف المؤشر
فئة المؤشر
الاتجاه
نوع المخرجات
التصور
متطلبات البيانات
أعمدة السعر فقط
الحجم
بيانات التيك
الإشارات المدعومة
تقاطع
التباين
الانقطاع
الانعكاس
قوة الاتجاه
التقلب
تقييمات العملاء
0.0
التقييمات: 0
تقييمات العملاء
لا توجد تقييمات لهذا المنتج حتى الآن. هل جرَّبته بالفعل؟ كن أول من يخبر الآخرين!
مناقشة
الأسئلة الشائعة
MACD
يتم توفير المنتجات المتاحة من خلال cTrader Store، بما في ذلك روبوتات التداول والمؤشرات والإضافات، من قبل مطوري الطرف الثالث وإتاحتها لأغراض الوصول المعلوماتي والفني فقط. cTrader Store ليس وسيطًا ولا يقدم نصائح استثمارية أو توصيات شخصية أو أي ضمان للأداء المستقبلي.
المزيد من هذا المؤلف




















السعر
534.4M
حجم التداول
9.76M
الربح بالبيب
4
المبيعات