
Açıklama
Standart Pivot Noktalarının hesaplanması için formül şudur:
PP = (Yüksek + Düşük + Kapanış)/3
S1 = (PP * 2) – Yüksek
S2 = PP – (Yüksek – Düşük)
S3 = Düşük – 2(Yüksek – PP)
R1 = (PP * 2) – Düşük
R2 = PP + (Yüksek – Düşük)
R3 = Yüksek + 2(PP – Düşük)
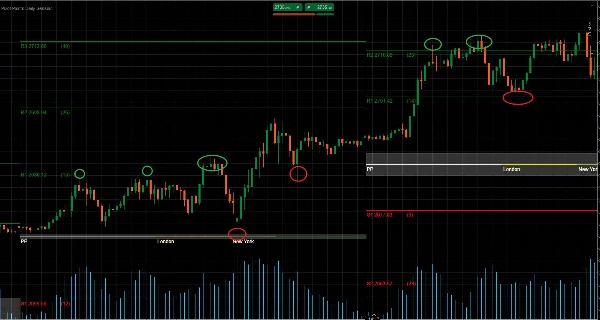
Pivot noktaları genel trendi belirlemek için kullanılabilir, çünkü pivot noktalarının yukarı yönde aşılması bir yükseliş trendini gösterir. Öte yandan, fiyatın bir oturum sırasında pivot noktalarının altına düşmeye devam etmesi ise bir düşüş trendine işaret eder.
Aralıklı bir piyasada, yatırımcılar dirençte satış (kısa pozisyon) ve destek noktasında alış (uzun pozisyon) yapabilirler. Örneğin, piyasa R1 ile S1 arasında kalıyorsa, alış emirleri S1 civarında, satış emirleri ise R1 civarında verilir.
Trend olan bir piyasada, ilgili Pivot Noktaları ana trendin devamı için geri çekilme piyasalarında referans noktası olarak görev yapar. Örneğin, fiyatlar yükseliş trendinde PP'nin üzerinde ancak R2'nin altında ise, yatırımcılar R1 civarında karlı alış emirleri vermeyi düşünebilirler.
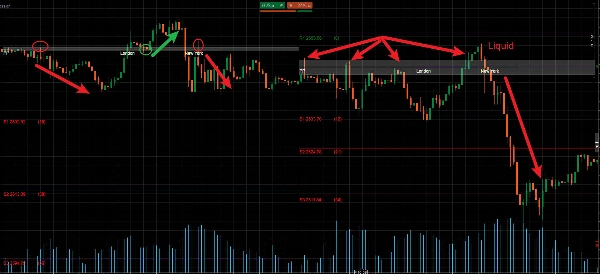
Destek ve direnç seviyeleri piyasada bazı durumlarda kırılacaktır. Bu kırılma dönemleri piyasada birçok ticaret fırsatı sunabilir. Pivot noktaları ayrıca piyasadaki potansiyel fiyat kırılmalarını ticaret yapmak için kullanılabilir.
Fiyat kırılmaları, fiyatın mevcut bir destek veya direnç seviyesini aşması ve bu seviyenin rolünü etkili bir şekilde değiştirmesi durumunda gerçekleşir. Örneğin, S2'de aşağı yönlü bir kırılma olursa, pivot çizgisi artık destek çizgisi olmayacak ve direnç çizgisi olarak kabul edilecektir.
Bu senaryoda, sadece S2'nin altında satış emirleri dikkate alınacak ve diğer pivot çizgileri zarar durdurma ve kar alma yerleşiminde rehberlik edecektir. Satış emirleri için zarar durdurma S2 ve S1'in üzerinde, kar hedefleri ise S3 ve altında yerleştirilebilir.
中文说明:
枢轴点可用于识别整体趋势,因为价格向上突破枢轴点表明上升趋势。与此同时,相反的情况,即价格在交易时段内持续跌破枢轴点,则表明下降趋势。
在区间震荡市场中,交易者可以简单地在阻力位做空(卖出)和在支撑位做多(买入)。例如,如果市场在R1和S1之间波动,买单将放置在S1附近,卖单放置在R1附近。
在趋势市场中,相关的枢轴点将作为回调市场恢复主要趋势的参考点。例如,如果在上升趋势中价格高于PP但低于R2,交易者可以考虑在R1附近设置有利可图的买单。
支撑位和阻力位在某些市场情况下必然会被突破。这些突破期可以在市场中提供许多交易机会。枢轴点也可用于交易市场中潜在的价格突破。
价格突破发生在价格冲破现有的支撑位或阻力位并有效转换其角色时。例如,如果在S2处发生向下突破,该枢轴线将不再是支撑线,而将被视为阻力线。
在这种情况下,只有在S2下方才会考虑卖单,其他枢轴线可以指导止损和止盈的设置。卖单的止损可以设在S2和S1上方,盈利目标设在S3及以下。
Özet
Müşteri değerlendirmeleri
5 | 100 % | |
4 | 0 % | |
3 | 0 % | |
2 | 0 % | |
1 | 0 % |


