
説明
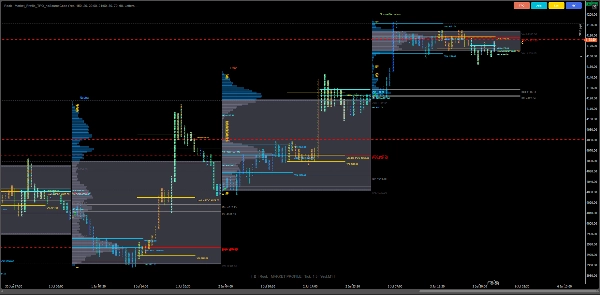
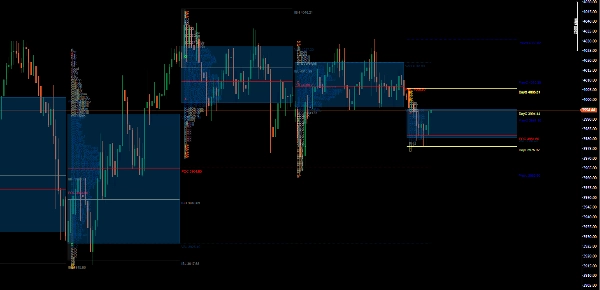
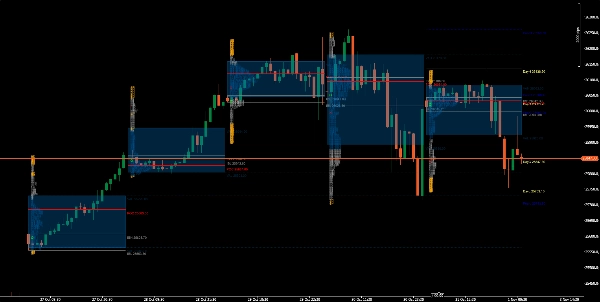
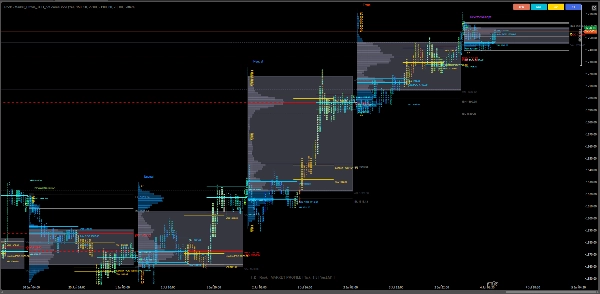
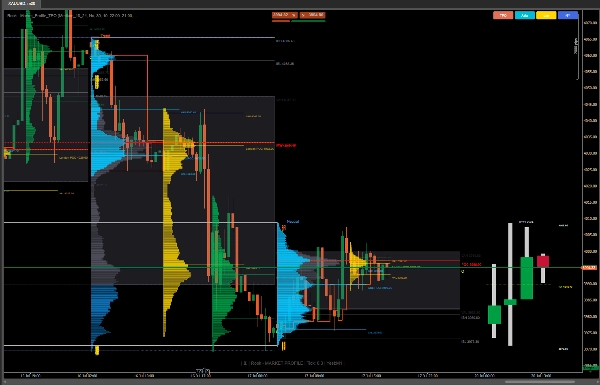
マーケットプロファイルTPO(タイム・プライス・オポチュニティ)は、機関投資家レベルの市場構造の可視化をcTraderにもたらし、トレーダーが価格、時間、出来高がセッションを通じてどのように相互作用するかを一つのインテリジェントなビューで確認できるようにします。
プロのデイトレーダー、オークションマーケットアナリスト、オーダーフロー愛好家向けに設計されたこのインジケーターは、市場活動の真の表現をTPO文字、ボックス、ヒストグラムを使って提供します。価値エリア、POCゾーン、初期バランスレンジ、ネイキッドレベルを正確に特定するのに役立ちます。
⚙️ コア機能
✅ (TPO) ビジュアライゼーション
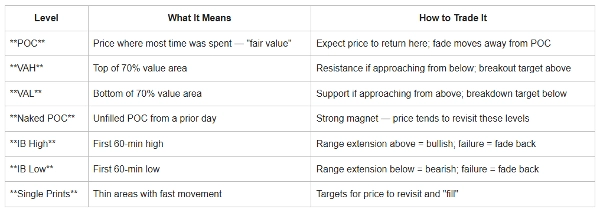
✅ POC & バリューエリアゾーン
✅ 進行中のPOC
✅ 初期バランス(IB)検出
✅ セッション & タイムゾーンインテリジェンス
✅ TPO表示モード(文字 / ヒストグラム)
✅ 始値/終値マーカー(O/X)
✅ シングルプリント & ネイキッドPOC/VAレベル
✅ 当日 & 前日OHLCオーバーレイ
✅ 当日 & 前日OHLCオーバーレイ
✅ HTFバー投影(AMD)
主な改善点
✔ 読み込み速度の向上
✔ メモリ管理の改善
✔ 正確なバリューエリア計算
✔ 正しいセッションプロファイルの位置付け
✔ トグルパフォーマンスの向上
✔ クロスプラットフォーム互換性
✔ UTCベースのセッション(自動DSTなし)
✔ ネイキッドPOC処理の改善
✔ プロファイルレンダリングの改善
🧭 トレーディングユースケース
🔹 日中オークション分析 — 価値が形成、移動、または破られている場所を特定します。
🔹 POC & バリューリバージョントレード — 均衡の再テストや極端な動きのフェードを狙います。
🔹 初期バランスブレイクアウト — セッションが最初の1時間のレンジを超えて拡大した時を見極めます。
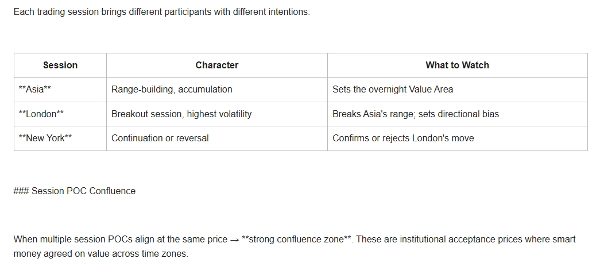
🔹 セッションローテーション研究 — アジア、ロンドン、ニューヨークのセッションをタイムゾーン調整で比較します。
🔹 機関投資家の文脈構築 — 出来高やデルタツールと組み合わせてスマートマネーフットプリントを検証します。
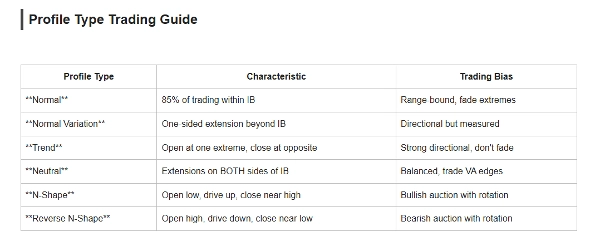
プロファイルタイプ
タイプ 市場状況
ノーマル バランスマーケット
ノーマルバリエーション 中程度のトレンド
トレンド 強い方向性の日
ニュートラル 両面オークション
N字型 強気オークション
逆N字型 弱気オークション
対象
- オークションマーケット理論(AMT)
- マーケットプロファイルトレーダー
- 日中トレーダー
- スイングトレーダー
- 先物トレーダー
- 外国為替トレーダー
- プロフェッショナルオーダーフロー分析
チャートに機関投資家の明確さをもたらします。
マーケットプロファイルTPOインジケーターは、生の価格データを価値、不均衡、そして機会の物語に変えます
免責事項: このインジケーターは教育および情報提供のみを目的としており、金融、投資、または取引のアドバイスを構成するものではありません。マーケットプロファイルは分析ツールであり、利益や将来の結果を保証するものではありません。
金融市場での取引は大きなリスクを伴い、過去のパフォーマンスが将来の結果を保証するものではありません。ユーザーは自身の取引判断、リスク管理、およびそれに伴う利益または損失について全責任を負います。
常にご自身で分析を行い、投資や取引の決定を行う前に資格のある金融専門家に相談してください。
概要
Key features include multiple TPO display modes (letters and histogram), session and timezone intelligence with UTC-based sessions, open/close price markers (O/X), single prints, naked POC/VA levels, and overlays of day and previous day OHLC data. The indicator supports analysis of various market conditions through profile types like Normal (balanced market), Normal Variation (moderate trend), Trend (strong directional day), Neutral (two-sided auction), N-Shape (bullish auction), and Reverse N-Shape (bearish auction).
It is suitable for professional day traders, auction market analysts, order flow enthusiasts, and traders across Forex, indices, and commodities markets. Typical use cases include intraday auction analysis, POC and value reversion trades, initial balance breakouts, session rotation studies, and institutional context building when combined with volume or delta tools.
This indicator provides a detailed, structured view of market dynamics to support informed trading decisions based on Auction Market Theory and Market Profile principles.
カスタマーレビュー
5 | 0 % | |
4 | 100 % | |
3 | 0 % | |
2 | 0 % | |
1 | 0 % |


