
Volume Profile Pro
Indikator
8 käufe
Version 1.0, Oct 2025
Windows, Mac
5.0
Bewertungen: 3
Beschreibung
Volume Profile Pro ist ein professionelles Fixed-Range-Volumenanalysetool, das für präzise Marktstruktur- und Liquiditätskartierung entwickelt wurde.
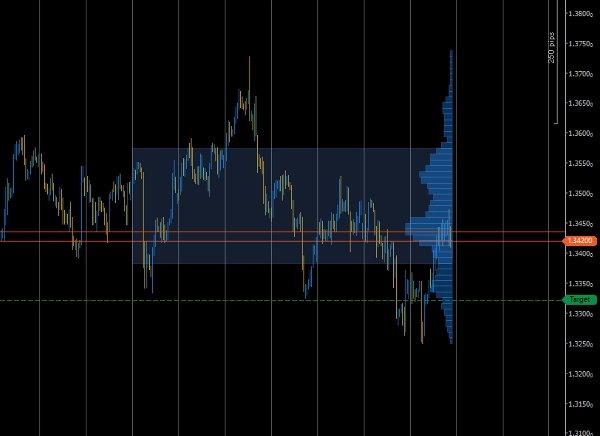
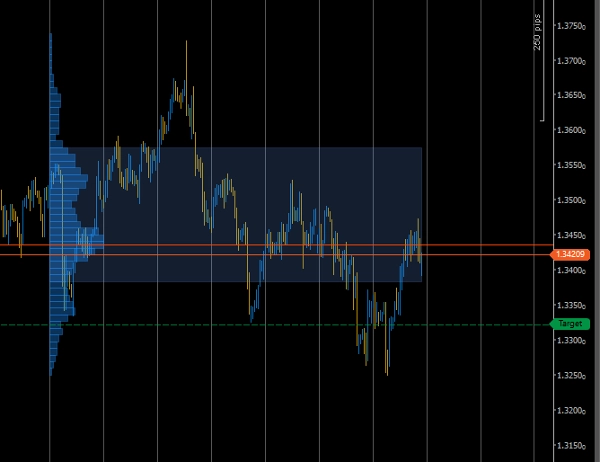
Es ermöglicht Ihnen, zu visualisieren, wie viel Handelsaktivität auf jeder Preisstufe innerhalb eines definierten Chartbereichs stattfand – und hilft Ihnen so, sofort Interessenszonen wie Hochvolumenknoten, den Point of Control (POC) und den 70% Value Area zu identifizieren.
Hauptmerkmale
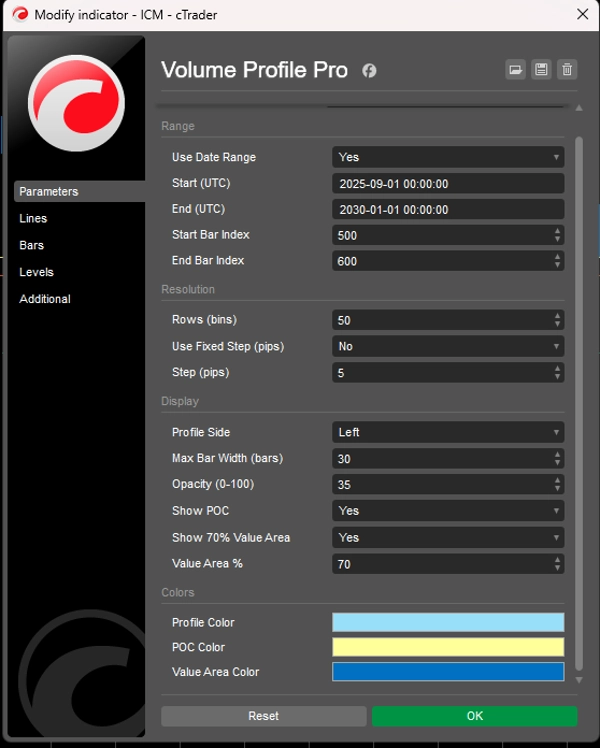
- 🧭 Fixed Range Auswahl – Definieren Sie einen benutzerdefinierten Bereich nach Datum oder Balkenindex, um nur die Region zu analysieren, die Sie interessiert.
- 📊 Genaue Volumenverteilung – Erstellt ein Volumenhistogramm aus Tick-Volumen über den gewählten Bereich.
- 🎯 POC & Value Area – Hebt automatisch den Point of Control und das 70%-Value-Area-Band hervor.
- ⚙️ Flexible Auflösung – Einstellbare Anzahl der Bins oder feste Schrittweite in Pips für benutzerdefinierte Granularität.
- 🎨 Saubere Visualisierung – Wählen Sie Seite (links/rechts), Breiten-Skalierung und Deckkraft für optimale Chartlesbarkeit.
- ⚡ Leichtgewichtig & Optimiert – Effiziente Berechnung für Echtzeit-Volumenstudien ohne Verlangsamung Ihres Terminals.
Funktionsweise
- Wählen Sie, ob Sie Datumsbereich oder Balkenindexbereich verwenden möchten.
- Definieren Sie Ihre Start- / Endparameter.
- Der Indikator berechnet das Tick-Volumen bei jedem Preisschritt und zeichnet horizontale Balken, die die relative Aktivität zeigen.
- Der längste Balken markiert den POC, und eine leicht schattierte Region zeigt die Value Area (Standard 70%).
Ideal für
- Intraday- und Swing-Trader, die die Liquiditätskonzentration analysieren.
- Strategieentwickler auf Volumenbasis, die datengesteuerte Zonen suchen.
- Trader, die POC- oder Value-Area-Umkehrungen/Konfluenzniveaus verwenden.
Zusammenfassung
KI-Zusammenfassung
Volume Profile Pro is a fixed-range volume analysis indicator designed to visualize trading volume distribution by price within a user-defined chart range. It calculates tick volume at each price level and displays a horizontal histogram that highlights key market structure elements such as the Point of Control (POC)—the price with the highest traded volume—and the 70% Value Area, representing the price range where most trading activity occurred. Users can select the analysis range by date or bar index and adjust the resolution through customizable bin counts or fixed pip steps. The indicator offers flexible visualization options, including side placement, width scaling, and opacity adjustments, to enhance chart readability. Its efficient computation supports real-time volume studies without impacting terminal performance. Volume Profile Pro is suitable for intraday and swing traders, volume-based strategy developers, and those utilizing POC or Value Area levels for trading decisions. It supports multiple markets and symbols, including Forex pairs (EURUSD, GBPUSD, NZDUSD, USDJPY), cryptocurrencies (BTCUSD), commodities (XAUUSD), indices (NAS100), and stocks.
Indikatorprofil
Kundenbewertungen
5.0
Bewertungen: 3
5 | 100 % | |
4 | 0 % | |
3 | 0 % | |
2 | 0 % | |
1 | 0 % |
Kundenbewertungen
October 20, 2025
Practical market note if the trader wants it adds useful information behind the price move. It works best as support, not a final decision maker. Volume context is stronger when POC, VWAP and value area agree across 2 sessions. volume alone can be noisy without price action.
October 19, 2025
October 19, 2025
Focused demo option for traders who want confirmation beyond candles. It gives value around volume based context, but volume alone can be noisy without price action. I would review 20 reactions near POC or VWAP before trusting the read. The data helps most when price action confirms the same zone.
Diskussion
Häufig gestellte Fragen (FAQ)
BTCUSD
Prop
Forex
Indices
Commodities
Crypto
Stocks
Über den cTrader Store verfügbare Produkte, einschließlich Handelsbots, Indikatoren und Plugins, werden von externen Entwicklern bereitgestellt und nur zu Informations- und technischen Zugriffszwecken verfügbar gemacht. cTrader Store ist kein Broker und erbringt keine Anlageberatung, persönlichen Empfehlungen oder eine Garantie für zukünftige Performance.


Preis
Seit 31/10/2024
56
Verkäufe
1.75K
Kostenlose Installationen