
Half Trend BT
Indikator
38 käufe
Version 1.0, Mar 2025
Windows, Mac
4.3
Bewertungen: 3
Beschreibung
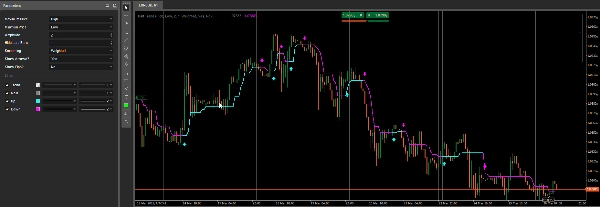
Der Half Trend Indikator ist dazu entwickelt, potenzielle Trendwenden zu erkennen und hervorzuheben, indem er die jüngsten Hoch- und Tiefpunkte über einen festgelegten Zeitraum vergleicht und entsprechend eine „Aufwärts-“ oder „Abwärts-“ Linie zeichnet. Optional werden Pfeile bei jeder Trendänderung gezeichnet und es können Pip-Differenzen zwischen Signalen angezeigt werden.
- Auswahl der Hoch-/Tief-Serie
- Der Indikator verwendet zwei Preisserien (standardmäßig Hoch und Tief), um lokale Maxima und Minima zu verfolgen.
- Sie können für jede Serie verschiedene Preistypen auswählen (z. B.
Open,Close,Medianusw.) über Maximum Price und Minimum Price aus.
- Gleitende Durchschnitte & Periodenberechnung
- Ein gleitender Durchschnitt (basierend auf dem gewählten Smoothing-Typ und der Amplitude-Periode) wird auf beide ausgewählten „Hoch“- und „Tief“-Preisserie angewendet.
- Der Indikator vergleicht die aktuellen Balkenpreise mit diesen geglätteten Hoch-/Tief-Werten, um zu entscheiden, ob von einem Aufwärtstrend zu einem Abwärtstrend (oder umgekehrt) gewechselt wird.
- Trenderkennung & Darstellung
- Wenn der Indikator einen Aufwärtstrend erkennt, zeichnet er die Up-Linie (cyan) und setzt
Trendauf+1. - Wenn ein Abwärtstrend erkannt wird, zeichnet er die Down-Linie (magenta) und setzt
Trendauf-1. - Die Main Ausgabe (grau) wird intern aktualisiert, um die aktuellen Unterstützungs-/Widerstandsniveaus widerzuspiegeln.
Trendist eine unsichtbare Ausgabeserie, die die Trendrichtung numerisch speichert (+1oder-1).
- Wenn der Indikator einen Aufwärtstrend erkennt, zeichnet er die Up-Linie (cyan) und setzt
- Pfeile & Pip-Berechnung
- Pfeile anzeigen? – Wenn aktiviert, zeichnet der Indikator bei jedem neuen Balken, an dem eine Trendwende erkannt wird, einen Pfeil.
- Pips anzeigen? – Wenn aktiviert, berechnet und zeigt er die Pip-Differenz zwischen dem letzten Signal und dem neuen Signal an und zeichnet ein kleines Label sowie eine Trendlinie im Chart.
Zusammenfassung
KI-Zusammenfassung
The Half Trend BT indicator detects potential trend reversals by analyzing recent highs and lows over a specified period. It compares two selected price series—typically High and Low, but configurable to other price types such as Open, Close, or Median—using moving averages based on chosen smoothing methods and amplitude periods. The indicator plots an "Up" line (cyan) when an uptrend is detected and a "Down" line (magenta) for a downtrend, while internally storing trend direction numerically (+1 or -1). A main output line (gray) reflects current support and resistance levels. Optional features include drawing arrows on bars where trend reversals occur and calculating pip differences between signals, which are displayed as labels and trendlines on the chart. This indicator supports multiple markets including Forex, indices, commodities, cryptocurrencies, and stocks.
Indikatorprofil
Kundenbewertungen
4.3
Bewertungen: 3
5 | 33 % | |
4 | 67 % | |
3 | 0 % | |
2 | 0 % | |
1 | 0 % |
Kundenbewertungen
March 29, 2025
Clean idea for traders around chart reading. The useful part is adding confirmation before a trade, with the numbers checked before scaling. The cleaner reads should hold across 3 sessions, not just 1 good chart. It is stronger when a 1.5R target is realistic before the entry.
March 28, 2025
March 28, 2025
Decent tool for testing if the trader wants it makes market context easier to scan. It works best as support, not a final decision maker. I would test it on 2 timeframes, 20 signals and a 1R stop plan. it should not be used as a blind entry trigger.
Diskussion
Häufig gestellte Fragen (FAQ)
Prop
Forex
Signal
Indices
Commodities
Crypto
Stocks
Über den cTrader Store verfügbare Produkte, einschließlich Handelsbots, Indikatoren und Plugins, werden von externen Entwicklern bereitgestellt und nur zu Informations- und technischen Zugriffszwecken verfügbar gemacht. cTrader Store ist kein Broker und erbringt keine Anlageberatung, persönlichen Empfehlungen oder eine Garantie für zukünftige Performance.


![„[Stellar Strategies] Smart ADX“-Logo](https://cdn.ctrader.com/image/webp/af13b084-b6f6-41db-b7bc-c7e688b57b05_36929)


Preis
48
Verkäufe
1.02K
Kostenlose Installationen