
Price Level DWM BT
Indicatore
Versione 1.0, Dec 2025
Windows, Mac
4.7
Recensioni: 4
Descrizione
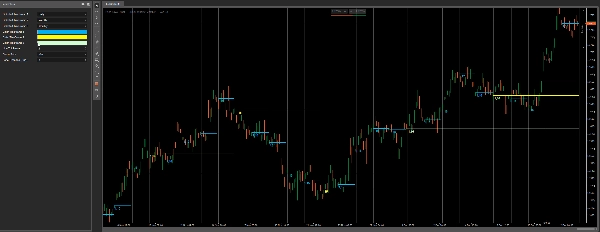
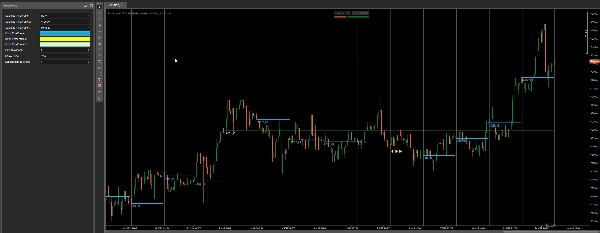
Livello di Prezzo DWM di Bullitt Traders
Livello di Prezzo DWM Livelli di variazione del prezzo Giornalieri, Settimanali, Mensili tracciati in modo pulito, livelli di riferimento a timeframe superiore direttamente sul tuo grafico — così sai sempre dove si trova il prezzo rispetto ai principali punti di riferimento Giornalieri, Settimanali e Mensili.
Questi livelli sono ampiamente utilizzati per:
- contesto di bias e direzione
- reazioni di supporto/resistenza intraday
- decisioni di ritorno alla media vs. continuazione
- “trading di posizione” (dove il prezzo sta negoziando rispetto al timeframe superiore)
Mantieni il tuo grafico minimale, veloce e leggibile pur avendo il contesto HTF in vista.
Cosa ottieni
- Fino a 3 livelli di riferimento a timeframe superiore contemporaneamente
- Giornaliero / Settimanale / Mensile selezionabili tramite menu a tendina
- Colori separati per timeframe
- Spessore regolabile
- Etichetta prezzo opzionale (pulita e discreta)
Caratteristiche principali
- Tracciamento minimalista dei livelli HTF (progettato per grafici puliti)
- Livelli di riferimento non ridipinti (basati su dati HTF completati)
- Funziona bene con sessioni, zone S&D, struttura di mercato, strumenti ICT e altro
- Adatto per FX, indici, oro — qualsiasi mercato
Impostazioni
- Seleziona TimeFrame 1 / 2 / 3
- Colore per timeframe
- Spessore linea
- Mostra etichetta prezzo (on/off)
- Distanza etichetta (offset visivo)
Note
- Utilizza dati a timeframe superiore completati per mantenere i livelli stabili e coerenti.
Riepilogo
Profilo indicatore
Categoria indicatore
Volatilità
Tipo di output
Segnali
Requisiti per i dati
Dati esterni
Segnali supportati
Livello rotto
Recensioni dei clienti
4.7
Recensioni: 4
5 | 75 % | |
4 | 25 % | |
3 | 0 % | |
2 | 0 % | |
1 | 0 % |
Recensioni dei clienti
February 9, 2026
Price Level DWM BT provides clean and accurate daily, weekly and monthly levels. Best used from M5 and higher timeframes, where levels stay readable and meaningful. A great context tool for intraday and swing traders who rely on higher-TF structure, reactions and trade planning.
December 18, 2025
The setup needs less second guessing, but overconfidence is the real danger.
December 15, 2025
pretty fine as one more layer, especially in mixed charts. A few signals across sessions tell more.
Discussioni
Domande frequenti
Prop
Forex
Signal
Breakout
Scalping
Commodities
Crypto
I prodotti disponibili tramite cTrader Store, inclusi bot di trading, indicatori e plugin, sono forniti da sviluppatori terzi e resi disponibili esclusivamente a scopo informativo e di accesso tecnico. cTrader Store non è un broker e non fornisce consulenze in materia di investimento, raccomandazioni individualizzate o garanzie di risultati futuri.


Prezzo
48
Vendite
1.06K
Installazioni gratuite