คำอธิบาย
Belkhayate PRC (ช่องรีเกรสชันพหุนาม)
1 เส้นโค้ง 3 แถบเบี่ยงเบน โครงสร้างที่ชัดเจน
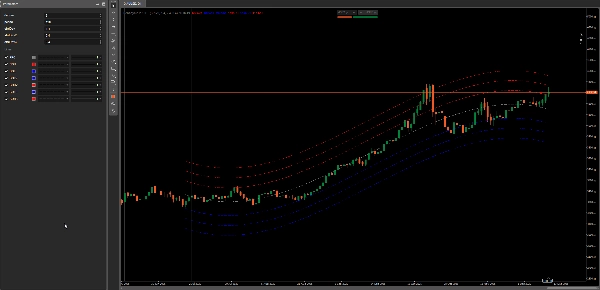
Belkhayate PRC คือ ช่องรีเกรสชันพหุนาม ที่มีซองเบี่ยงเบนมาตรฐาน 3 ซอง
ช่วยให้คุณมองเห็น โซนค่าเฉลี่ย การขยาย และการหมดแรง ได้อย่างง่ายดาย: ราคามักจะแกว่งไปรอบเส้นโค้งรีเกรสชันที่เรียบเนียน — และแถบด้านนอกมักทำหน้าที่เหมือน พื้นที่ตอบสนองที่ใช้งานได้จริง.
เวอร์ชันนี้ ฟรี เพราะผมต้องการให้นักเทรดทุกคนสามารถทดสอบ เข้าใจ และตัดสินใจได้ว่ามันเหมาะกับกระบวนการทำงานของพวกเขาหรือไม่
สิ่งที่มันทำ
เส้นโค้งรีเกรสชันพหุนาม (PRC)
- เหมาะกับเส้นโค้งรีเกรสชันที่เรียบเนียนกับแท่งเทียนล่าสุด N แท่ง (ช่วงเวลาของคุณ)
- ระดับ 1–4: จากการทำให้เรียบอย่างอ่อนโยนไปจนถึงความโค้งที่แข็งแรงขึ้น
แถบเบี่ยงเบน (3 ระดับ)
- 3 ซองที่อิงจากข้อผิดพลาดรีเกรสชัน (ส่วนเบี่ยงเบนมาตรฐาน)
- มีประโยชน์เป็น “โซน” สำหรับการดึงกลับ, จุดสุดขีด และเงื่อนไขการกลับสู่ค่าเฉลี่ย
ทำไมมันถึงมีประโยชน์
- ความชัดเจนของแนวโน้มโดยไม่ต้องซ้อน MA ที่ล่าช้า
PRC ให้ “จุดศูนย์ถ่วง” ที่ชัดเจนสำหรับช่วงเวลาล่าสุด - จุดสุดขีดที่มีโครงสร้าง
แถบช่วยให้คุณตัดสินใจได้ว่าเมื่อไหร่ราคาถูกยืดออกไปเทียบกับเมื่อมันกลับเข้าสู่พื้นที่ปกติ - เหมาะสำหรับบริบท + การดำเนินการ
ใช้ TF ที่สูงกว่าเพื่อทิศทาง/บริบท และ TF ที่ต่ำกว่าเพื่อเข้าทำในโซนเส้นโค้งหรือแถบ
ประวัติ / ที่มาของแนวคิด
เครื่องมือนี้ได้รับแรงบันดาลใจจากแนวคิดคลาสสิกของ ช่องรีเกรสชัน ที่ใช้ในวิเคราะห์ทางเทคนิค (การเหมาะสมเส้น/เส้นโค้งรีเกรสชันกับราคาและสร้างซองตามเบี่ยงเบน)
ชื่อ “Belkhayate” มักเกี่ยวข้องกับเวอร์ชันที่ได้รับความนิยมของช่องสไตล์ PRC นี้ที่แชร์กันในชุมชนนักเทรด
การใช้งาน cTrader ของผมเป็น การสร้างใหม่ที่สะอาด มุ่งเน้นที่ความเสถียร การตั้งค่า และการใช้งานจริงบนชาร์ตสมัยใหม่
การใช้งานที่แนะนำ
- ตลาดแนวโน้ม: เทรดการดึงกลับเข้าสู่ PRC จัดการความเสี่ยงโดยใช้แถบที่ใกล้ที่สุด
- ตลาดช่วง: ต้านจุดสุดขีด (แถบ 2 / แถบ 3) กลับเข้าสู่ PRC
- ตรวจสอบความผันผวน: แถบที่ขยาย = ความผันผวนที่ขยายตัว / การเร่งความเร็ว
สรุป
This indicator helps traders identify mean zones, expansion phases, and exhaustion points by showing how price oscillates around the regression curve, with outer bands often acting as reaction areas. It is applicable across various markets including Forex, indices, commodities, stocks, and cryptocurrencies, supporting symbols like BTCUSD, EURUSD, GBPUSD, XAUUSD, NAS100, and USDJPY.
Recommended uses include trading pullbacks toward the PRC in trending markets, fading extremes in ranging markets, and monitoring volatility through band width changes. The tool is designed for clarity and practical usability on modern charts, suitable for combining higher timeframes for context with lower timeframes for execution.
รีวิวจากลูกค้า
5 | 100 % | |
4 | 0 % | |
3 | 0 % | |
2 | 0 % | |
1 | 0 % |