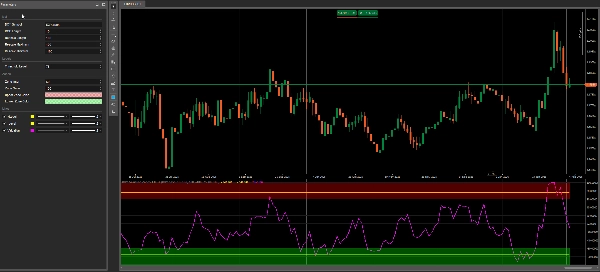
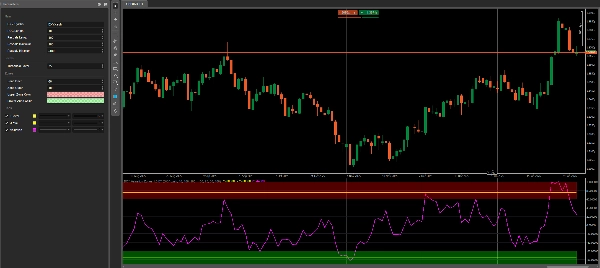
DXY Valuation Zones 1.0 BT
Gösterge
Version 1.0, Feb 2026
Windows, Mac
"DXY Valuation Zones 1.0 BT" yüklenen resmi"DXY Valuation Zones 1.0 BT" yüklenen resmi
18
Satışlar
462
Ücretsiz yüklemeler
Deneme sürümü hakkında
14 Days Trial

DXY Valuation Zones 1.0 BT shows a clean DXY-relative valuation line for your chart symbol and highlights two simple context areas: an Over Zone and an Under Zone.
It’s built as a Daily (D1) context filter — no clutter, just clear zones + a configurable ±Threshold level.

All zone colors use the native cTrader color picker, so you can control transparency directly via the opacity slider inside the palette.

Recommended Use (Best on Daily)

This indicator works best on USD-related pairs, because DXY represents broad USD strength.

Examples:

  • XXXUSD: EURUSD, GBPUSD, AUDUSD, NZDUSD
  • USDXXX: USDJPY, USDCAD, USDCHF

Quick Start (recommended defaults)

  • Timeframe: Daily (D1)
  • Over Zone: +70 … +100
  • Under Zone: -70 … -100
  • Threshold: ±75 (adjustable)
  • DXY Symbol: DXY.cash (or your broker’s DXY name)


How it works (simple)

  1. Calculates ROC (percent change) for your chart symbol
  2. Calculates the same ROC for DXY
  3. Uses the difference (Symbol ROC – DXY ROC)
  4. Rescales the result into a stable -100 … +100 range


How to read it

  • Valuation > +Threshold → stretched / “Over” context
  • Valuation < -Threshold → stretched / “Under” context
  • In-between → neutral context

Use it as a bias & location filter, not as a standalone entry signal.


Important (Broker requirement)

This indicator requires a broker-provided DXY symbol (example: DXY.cash).
Tested on FTMO (availability and naming may vary by broker feed).
If your broker uses a different name, just change the DXY Symbol pa

0.0
Değerlendirmeler: 0
Müşteri değerlendirmeleri
Bu ürün için henüz bir değerlendirme yok. Ürünü denediniz mi? O zaman ona dair görüşlerini paylaşan ilk kişi olun!
Prop
Forex
Signal

Bu oluşturanın diğer ürünleri

Gösterge
Forex
Signal
Market Session BT
Market Session BT
Gösterge
Indices
Prop
Commodities
+4
Half Trend BT
Half Trend BT by BullittTraders
Gösterge
Indices
Prop
Commodities
+3
Camarilla 1.5 BT
Camarilla by Bullitt Traders — a precise, non-repainting pivot indicator for cTrader.
Gösterge
Indices
Prop
Commodities
+3
HMA MTF 2.0
HMA MTF 2.0 (Multi-Timeframe )
Gösterge
Indices
Prop
Stocks
+3
Bar Time
Bar Time Timeframe / Renko
Gösterge
Indices
Breakout
Prop
+2
Price Change Bundle 1.0 BT
Price Change Bundle 3-in-1 Levels • Bars • Histogram. Secret of Price Change
Gösterge
NAS100
NZDUSD
Indices
+9
Belkhayate PRC BT
Belkhayate PRC (Polynomial Regression Channel)
Gösterge
Indices
Breakout
Prop
+6
Price Level DWM BT
Price Level DWM BT
Gösterge
NAS100
NZDUSD
XAUUSD
+11
Half Trend Cloud BT
Half Trend Cloud

Şunları da beğenebilirsiniz

Gösterge
Breakout
AutoLines™ Support & Resistance
FlexSR auto‑detects pivot highs/lows to plot dynamic support & resistance lines Features customizable styling and option
Gösterge
NAS100
NZDUSD
XAUUSD
+17
Liquidity Sweep FVG + MSS + HTF
Precision SMC tool with HTF sweeps, MSS confirmation & smart FVG detection for high-probability reversals.
Fx4U.Multi Trend Line Indicator
Allow trader to draw multi trendlines in different timeframes on one chart,Give trader an overview of the current market
Gösterge
RSI
Breakout
XAUUSD
+5
Dynamic Range MomentumI
This histogram helps visualize the strength and direction of market movements, making it easier to spot potential trends
Gösterge
Stocks
Forex
Crypto
+1
Market Structure SNR + Auto Bias
Market Structure Indicator – Your Trading Map in a Noisy Market. No more Panicking Which one, Where, Why and How.
Bollinger Bands Breakout Oscillator (+ Alerts)
BB Breakout Oscillator with alerts! Spot trend reversals using Bollinger Bands. Bullish/Bearish crossovers Alerts.
Gösterge
Indices
E7 BlackScholes Model
Option pricing using the BlackScholes model and the Math.Numerics packages
Gösterge
RSI
MACD
sarah trend
Un indicateur tout-en-un intelligent qui détecte la tendance, donne un avis clair (achat/vente)
Gösterge
RSI
Breakout
XAUUSD
+12
Liquidity Pressure Index
Liquidity Pressure Index is a tool that gives traders deeper insights into the hidden dynamics of market liquidity
Renko Moving Average Cross Indicator
The Renko Moving Average Cross indicator combines classic EMA crossover signals with Renko-filtered prices.
En yüksek puanlı
Ücretsiz
ADX and ADI
This custom indicator is a complete implementation of the Average Directional Index and Directional Indicators.
Daily SD Levels - Indicator
Plots intraday VWAP and dynamic ±1/±2 standard deviation (SD) bands based on current day’s price and volume.
18
Satışlar
462
Ücretsiz yüklemeler