
Price Level DWM BT
Gösterge
Sürüm 1.0, Dec 2025
Windows, Mac
4.7
Değerlendirmeler: 4
Açıklama
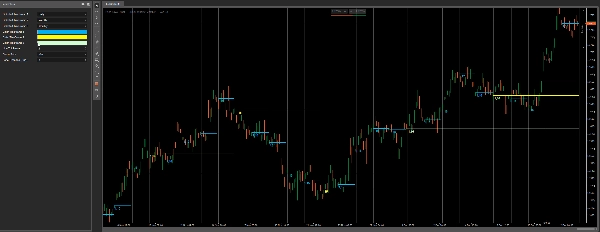
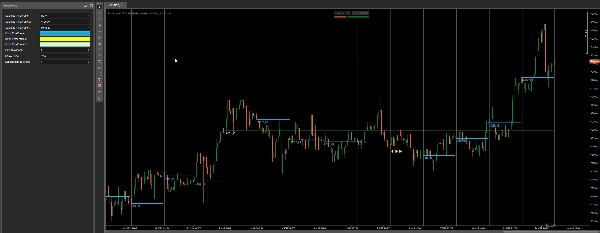
Bullitt Traders tarafından Fiyat Seviyesi DWM
Fiyat Seviyesi DWM Günlük Haftalık Aylık Fiyat Değişim Seviyeleri, temiz, daha yüksek zaman dilimi referans seviyelerini doğrudan grafiğinize çizer — böylece fiyatın önemli Günlük, Haftalık ve Aylık kıstaslara göre nerede olduğunu her zaman bilirsiniz.
Bu seviyeler yaygın olarak şunlar için kullanılır:
- önyargı ve yön bağlamı
- gün içi destek/direnç tepkileri
- ortalama dönüşü vs. devam kararı
- “konum ticareti” (fiyatın daha yüksek zaman dilimine göre nerede işlem gördüğü)
Grafiğinizi minimal, hızlı ve okunabilir tutun ve yine de HTF bağlamını görünümde bulundurun.
Size sunulanlar
- Aynı anda 3 daha yüksek zaman dilimi referans seviyesi
- Günlük / Haftalık / Aylık açılır menü ile seçilebilir
- Zaman dilimine göre ayrı renkler
- Ayarlanabilir kalınlık
- İsteğe bağlı fiyat etiketi (temiz ve göze batmayan)
Ana Özellikler
- Minimalist HTF seviye çizimi (temiz grafikler için tasarlanmıştır)
- Yeniden çizilmeyen referans seviyeleri (tamamlanmış HTF verilerine dayanır)
- İyi çalışır seanslar, S&D bölgeleri, piyasa yapısı, ICT araçları ve daha fazlasıyla
- Uygun FX, endeksler, altın — herhangi bir piyasa için
Ayarlar
- Zaman Dilimi 1 / 2 / 3 seçin
- Zaman dilimine göre renk
- Çizgi kalınlığı
- Fiyat etiketini göster (açık/kapalı)
- Etiket mesafesi (görsel kaydırma)
Notlar
- Seviyeleri stabil ve tutarlı tutmak için tamamlanmış daha yüksek zaman dilimi verilerini kullanır.
Özet
Gösterge profili
Gösterge kategorisi
Volatilite
Çıktı türü
Sinyaller
Veri gereklilikleri
Haricî veriler
Desteklenen sinyaller
Seviye kırılması
Müşteri değerlendirmeleri
4.7
Değerlendirmeler: 4
5 | 75 % | |
4 | 25 % | |
3 | 0 % | |
2 | 0 % | |
1 | 0 % |
Müşteri değerlendirmeleri
February 9, 2026
Price Level DWM BT provides clean and accurate daily, weekly and monthly levels. Best used from M5 and higher timeframes, where levels stay readable and meaningful. A great context tool for intraday and swing traders who rely on higher-TF structure, reactions and trade planning.
December 18, 2025
The setup needs less second guessing, but overconfidence is the real danger.
December 15, 2025
pretty fine as one more layer, especially in mixed charts. A few signals across sessions tell more.
Tartışma
SSS
Prop
Forex
Signal
Breakout
Scalping
Commodities
Crypto
cTrader Store üzerinden erişilebilen işlem botları, göstergeler ve eklentiler gibi ürünler, üçüncü taraf sağlayıcılar tarafından sağlanır ve yalnızca bilgilendirme ve teknik erişim amaçlarıyla sunulur. cTrader Store bir broker değildir ve yatırım tavsiyesi, kişisel öneriler vermez veya gelecekteki performansı garanti etmez.


Fiyat
48
Satışlar
1.05K
Ücretsiz yüklemeler