
RSI Advanced
Gösterge
1 satın almalar
Sürüm 1.0, Apr 2026
Windows, Mac
5.0
Değerlendirmeler: 1

Açıklama
Standart Göreceli Güç Endeksi (RSI), dünyadaki en popüler göstergelerden biridir, ancak grafiğinizin altında tek bir çizgi çizmek artık modası geçmiş bir ticaret yöntemidir. Gerçek momentum değişimlerini, ivmelenmeyi ve piyasa dalgalanmalarını tespit etmeyi zorlaştırır.
The RSI Advanced bu klasik osilatörü tamamen yeniden tanımlıyor. Bir Sinyal Hattı, Volatilite Filtreleme ve Akıllı Grafik Boyama ekleyerek RSI'yı kapsamlı, hepsi bir arada bir momentum ve trend takip paneline dönüştürüyor.
Temel Özellikler
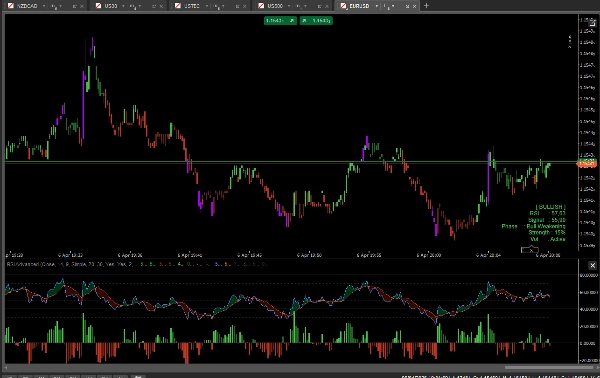
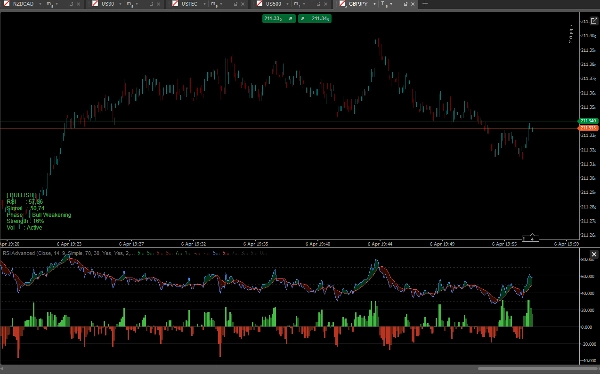
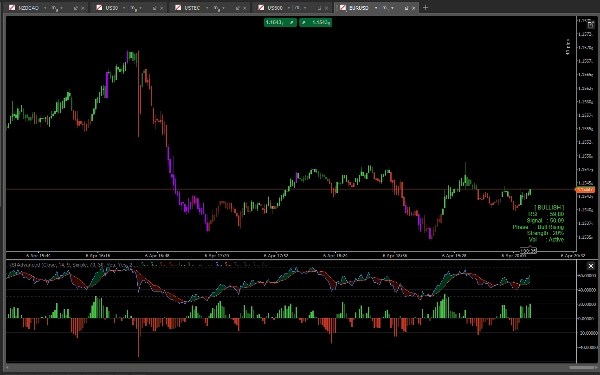
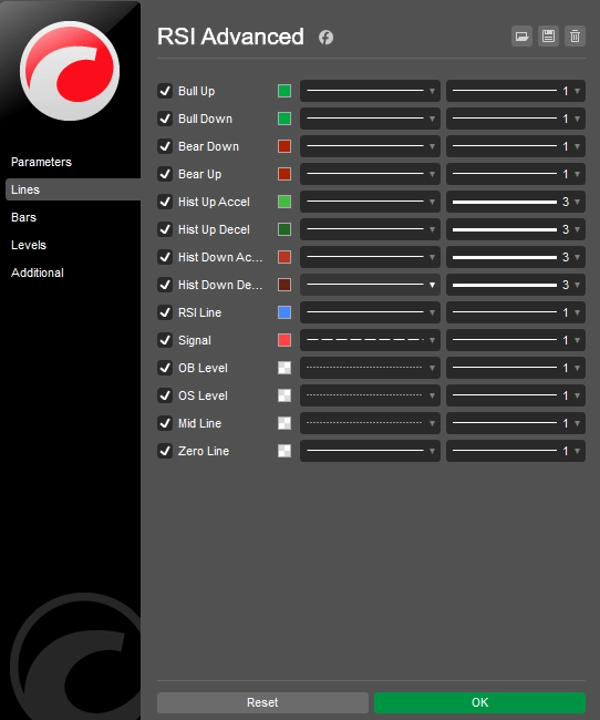
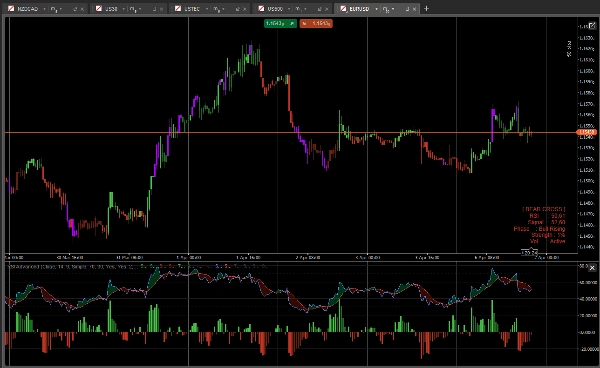
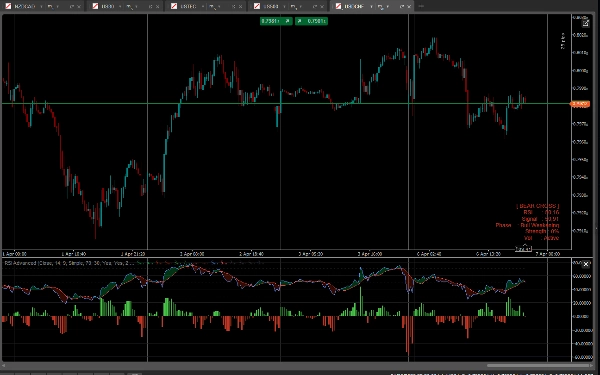
- RSI & Sinyal Bulutu: RSI'ya Hareketli Ortalama (Sinyal Hattı) ekledik. RSI ile Sinyal Hattı arasındaki alan dinamik bir Bulut ile doldurulur. Bulut Yeşil ise, Boğalar momentumu yönlendiriyor demektir. Kırmızı ise, Ayılar kontrolü elinde tutuyor.
- Momentum Histogramı: Ortalanmış bir histogram, RSI ile Sinyal Hattı arasındaki tam mesafeyi takip eder. Dahili ivmelenme/yavaşlama renkleri (parlak vs. koyu) ile kesişmeleri ve momentum tükenmesini önceden tahmin edebilirsiniz.
- Akıllı Çubuk Renklendirme (Paintbars): Mum çubuklarınız, temel RSI momentuma göre renk değiştirecektir:
-
- Parlak Yeşil/Kırmızı: Güçlü boğa/ayı uyumu (RSI > 50 ve RSI > Sinyal).
- Koyu Yeşil/Kırmızı: Zayıf momentum veya geri çekilmeler.
- Mor/Magenta: Aşırı Alım (OB) veya Aşırı Satım (OS) seviyeleri – potansiyel dönüşler konusunda sizi uyarır.
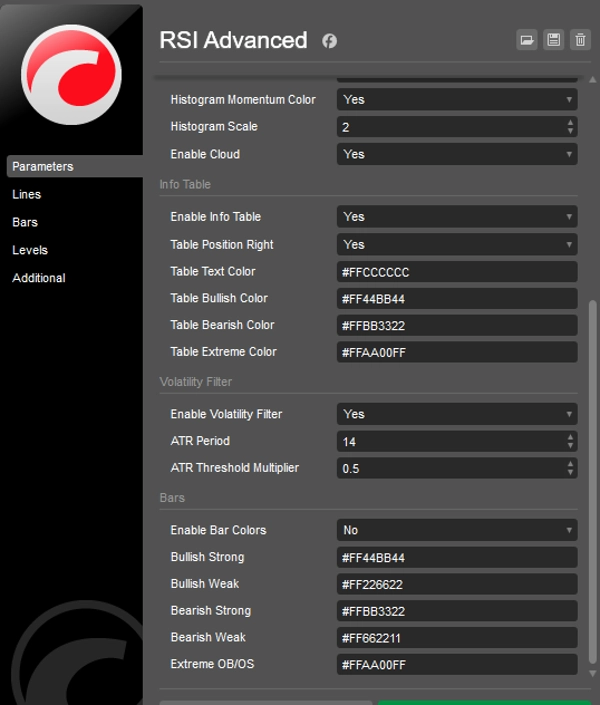
- Akıllı Volatilite Filtresi (ATR): Durgun piyasalarda sıkışmaktan bıktınız mı? Dahili ATR filtresini etkinleştirin. Volatilite tarihsel ortalamanızın altına düştüğünde, mumlar ve histogram griye döner, sizi kötü işlemlerden korur.
- Grafik Üzerinde Bilgi Paneli: Şık bir veri paneli gerçek zamanlı metrikleri gösterir: tam RSI ve Sinyal değerleri, Momentum Fazı, Trend Gücü yüzdesi ve Volatilite Durumu.
- Tamamen Açık: Herhangi bir sembolde (Forex, Kripto, Endeksler, Hisseler) ve herhangi bir zaman diliminde sınırsız işlem yapabilirsiniz. Ömür boyu erişim.
Nasıl işlem yapılır?
- Trend Devamı: RSI'nin 50 Orta Çizgisinin üzerinde kaldığı, ancak Sinyal Hattına hafifçe indiği geri çekilmeleri arayın. Histogram ivmelenirken (parlak yeşil) ve mumlar parlak yeşile dönerse, bu güçlü bir devam girişidir.
- Dönüşler: Mumlar Mor (Aşırı OB/OS) olduğunda, yüksek olasılıklı dönüş kurulumu için RSI'nın Sinyal Hattını tekrar geçmesini (Bulutun renk değiştirmesi) bekleyin.
- Dalgalanma Kaçınma: Volatilite Filtresi çubuklarınızı griye çevirdiğinde, sadece bekleyin ve piyasanın canlanmasını bekleyin.
Özet
Gösterge profili
Gösterge kategorisi
Volatilite
Çıktı türü
Filtre
Veri gereklilikleri
Yalnızca çubuklar
Desteklenen sinyaller
Kesişim
Trend gücü
Volatilite
Müşteri değerlendirmeleri
5.0
Değerlendirmeler: 1
5 | 100 % | |
4 | 0 % | |
3 | 0 % | |
2 | 0 % | |
1 | 0 % |
Müşteri değerlendirmeleri
April 11, 2026
The first thing that worked was timing feels less random, and a small account test feels safer.
Tartışma
SSS
BTCUSD
Forex
Signal
Indices
EURUSD
Commodities
GBPUSD
NZDUSD
RSI
AI
XAUUSD
NAS100
ATR
USDJPY
cTrader Store üzerinden erişilebilen işlem botları, göstergeler ve eklentiler gibi ürünler, üçüncü taraf sağlayıcılar tarafından sağlanır ve yalnızca bilgilendirme ve teknik erişim amaçlarıyla sunulur. cTrader Store bir broker değildir ve yatırım tavsiyesi, kişisel öneriler vermez veya gelecekteki performansı garanti etmez.


Fiyat
24
Satışlar
662
Ücretsiz yüklemeler