
Multi-Timeframe Market Levels
مؤشر
10 عمليات الشراء
الإصدار 1.0، Dec 2024
Windows, Mac
5.0
التقييمات: 1
الوصف
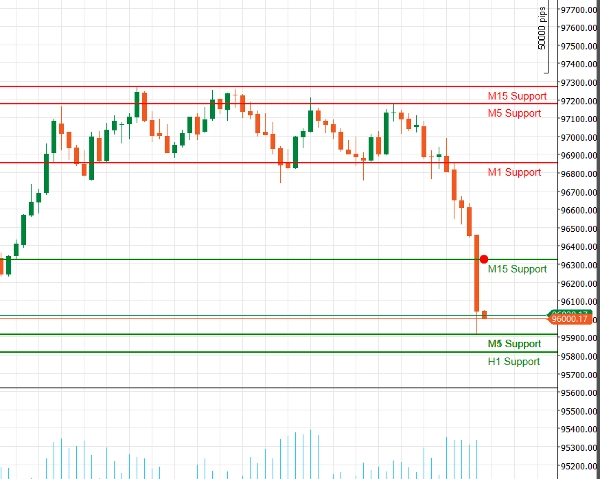
مؤشر الدعم والمقاومة المحسن
اكتشف قوة التحليل الفني مع مؤشر الدعم والمقاومة المحسن لـ cAlgo. تم تصميم هذه الأداة المتقدمة لمساعدة المتداولين على تحديد وتصور مستويات الدعم والمقاومة الحرجة على مخططات التداول الخاصة بهم، مما يعزز اتخاذ القرار واستراتيجيات التداول.
الميزات الرئيسية:
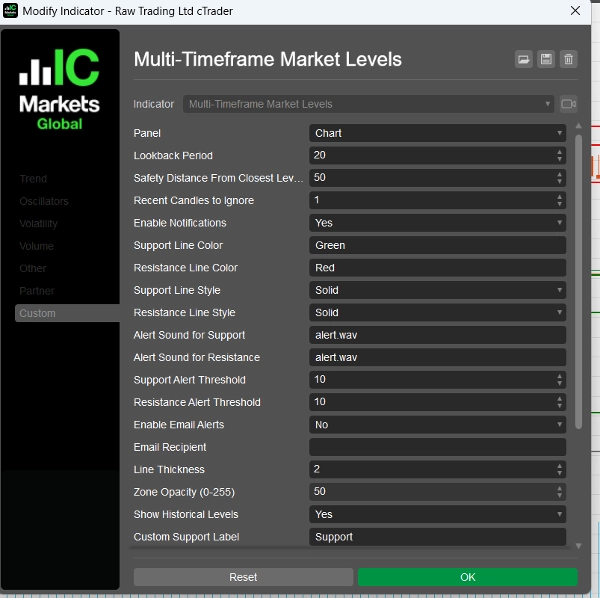
- معلمات قابلة للتخصيص: قم بتخصيص المؤشر ليتناسب مع أسلوب تداولك من خلال إعدادات قابلة للتعديل، بما في ذلك فترات النظر للخلف، مسافات الأمان، أصوات التنبيه، والمزيد.
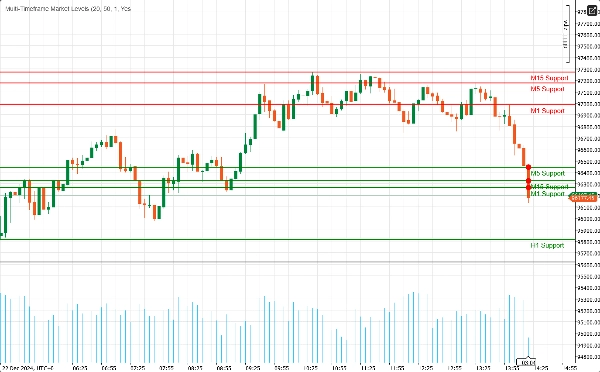
- دعم متعدد الأطر الزمنية: حلل أطر زمنية متعددة في نفس الوقت (M1، M5، M15، H1، H4، D1) للحصول على رؤية شاملة لديناميكيات السوق وتحديد المستويات الرئيسية عبر آفاق تداول مختلفة.
- تنبيهات في الوقت الحقيقي: ابق على اطلاع مع الإشعارات الفورية! يمكن للمؤشر إرسال تنبيهات صوتية وإشعارات بريد إلكتروني عندما يقترب السعر من مستويات الدعم أو المقاومة الحرجة، مما يضمن عدم تفويت أي فرصة تداول.
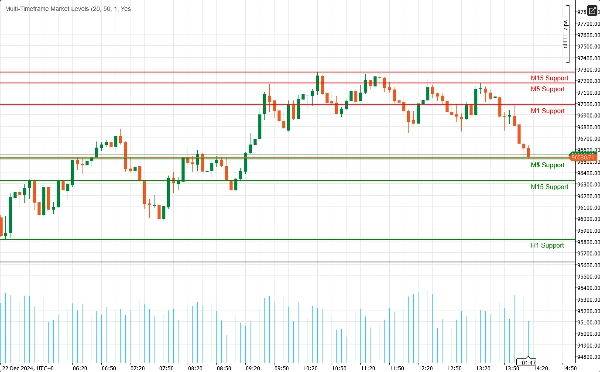
- وضوح بصري: استمتع بتمثيلات بصرية واضحة لمستويات الدعم والمقاومة، مع ألوان وأنماط خطوط قابلة للتخصيص. توفر المناطق المميزة سياقًا إضافيًا، مما يسهل التعرف على نقاط الانعكاس المحتملة.
- تكامل فيبوناتشي: عزز تحليلك مع رسم مستويات فيبوناتشي المدمجة، مما يتيح لك تحديد مستويات التصحيح والتمديد المحتملة بالتزامن مع الدعم والمقاومة.
- واجهة سهلة الاستخدام: مصمم لكل من المتداولين المبتدئين وذوي الخبرة، المؤشر سهل الإعداد ويتكامل بسلاسة مع بيئة cAlgo الحالية الخاصة بك.
كيفية استخدام مؤشر الدعم والمقاومة المحسن
- التثبيت:
-
- قم بتنزيل المؤشر واستيراده إلى منصة cAlgo الخاصة بك.
- قم بإرفاق المؤشر بالمخطط الذي ترغب به.
- تكوين المعلمات:
-
- اضبط الإعدادات لتناسب أسلوب تداولك. حدد فترة النظر للخلف، مسافة الأمان، واختر الألوان وأنماط الخطوط المفضلة لديك لمستويات الدعم والمقاومة.
- قم بتمكين الإشعارات إذا كنت ترغب في تلقي التنبيهات عندما يقترب السعر من هذه المستويات.
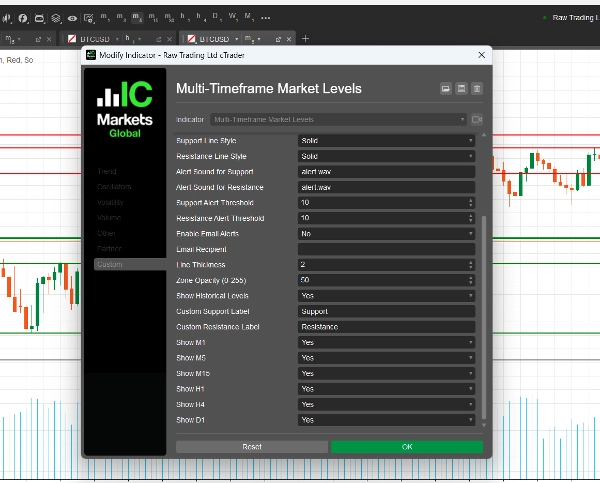
- اختيار الأطر الزمنية:
-
- اختر الأطر الزمنية التي تريد عرضها. يمكنك اختيار إظهار أو إخفاء المستويات من M1، M5، M15، H1، H4، وD1، حسب استراتيجيتك في التداول.
- تحليل المخطط:
-
- راقب مستويات الدعم والمقاومة المرسومة على مخططك. تشير هذه المستويات إلى الأماكن التي من المحتمل أن ينعكس أو يتماسك فيها السعر.
كيفية التداول باستخدام مؤشر الدعم والمقاومة المحسن
- تحديد نقاط الدخول:
-
- الصفقات الطويلة: ابحث عن فرص شراء عندما يقترب السعر من مستوى دعم، خاصة إذا أظهر علامات على الارتداد (مثل أنماط الشموع الصاعدة).
- الصفقات القصيرة: فكر في البيع عندما يقترب السعر من مستوى مقاومة، خصوصًا إذا كانت هناك إشارات هبوطية (مثل أنماط الشموع الهابطة).
- استخدام التنبيهات:
-
- استخدم التنبيهات في الوقت الحقيقي لإعلامك عندما يقترب السعر من مستويات الدعم أو المقاومة الرئيسية. هذا يسمح لك بالتصرف بسرعة والاستفادة من فرص التداول المحتملة.
- الدمج مع مؤشرات أخرى:
-
- عزز استراتيجيتك بدمج مؤشر الدعم والمقاومة المحسن مع مؤشرات فنية أخرى (مثل المتوسطات المتحركة، RSI، MACD) لتأكيد الإشارات وتحسين دقة صفقاتك.
- تحديد مستويات وقف الخسارة وجني الأرباح:
-
- ضع أوامر وقف الخسارة أسفل مستويات الدعم للصفقات الطويلة وفوق مستويات المقاومة للصفقات القصيرة لإدارة المخاطر.
- حدد أهداف جني الأرباح عند مستوى الدعم أو المقاومة المهم التالي لتعظيم الأرباح المحتملة.
لماذا تختار مؤشر الدعم والمقاومة المحسن؟
قد يكون التنقل في تعقيدات الأسواق المالية تحديًا. مؤشر الدعم والمقاومة المحسن يزودك بالأدوات التي تحتاجها لتحديد مستويات السعر الرئيسية واتخاذ قرارات تداول مستنيرة. سواء كنت متداول يومي أو مستثمر طويل الأجل، فإن هذا المؤشر هو إضافة أساسية إلى مجموعة أدوات التداول الخاصة بك.
الملخص
ملخص الذكاء الاصطناعي
The Multi-Timeframe Market Levels indicator for cAlgo is an enhanced support and resistance tool designed to assist traders in identifying critical price levels across multiple timeframes. It supports simultaneous analysis of M1, M5, M15, H1, H4, and D1 charts, providing a comprehensive view of market dynamics. Key features include customizable parameters such as lookback periods, safety distances, alert sounds, and visual settings like colors and line styles for clear chart representation. The indicator integrates Fibonacci levels to identify potential retracement and extension zones alongside support and resistance. Real-time alerts via audio and email notify users when price approaches key levels, facilitating timely trading decisions. The user-friendly interface is suitable for both novice and experienced traders and integrates seamlessly into the cAlgo platform. Traders can use the indicator to identify entry points for long and short trades, set stop-loss and take-profit levels based on support and resistance, and combine it with other technical indicators like RSI and MACD for enhanced strategy accuracy. Installation involves importing the indicator into cAlgo and attaching it to desired charts, followed by parameter configuration and timeframe selection. This tool aids in visualizing potential reversal or consolidation zones to support informed trading decisions.
ملف تعريف المؤشر
تقييمات العملاء
5.0
التقييمات: 1
5 | 100 % | |
4 | 0 % | |
3 | 0 % | |
2 | 0 % | |
1 | 0 % |
تقييمات العملاء
August 18, 2025
Displays support/resistance levels from multiple timeframes in one chart. Clear visual hierarchy and flexible settings. Cons: No alerts or tooltips. Can't save presets or filter levels dynamically.
مناقشة
الأسئلة الشائعة
RSI
MACD
يتم توفير المنتجات المتاحة من خلال cTrader Store، بما في ذلك روبوتات التداول والمؤشرات والإضافات، من قبل مطوري الطرف الثالث وإتاحتها لأغراض الوصول المعلوماتي والفني فقط. cTrader Store ليس وسيطًا ولا يقدم نصائح استثمارية أو توصيات شخصية أو أي ضمان للأداء المستقبلي.


السعر
منذ 22/11/2024
133
المبيعات
2.58K
التثبيتات المجانية