Mô tả
🧠 Chỉ báo RSI Nâng cao – Phân tích Động lượng Chính xác
Hiểu sâu hơn về Xu hướng Thị trường với RSI Thông minh hơn
Chỉ báo RSI Nâng cao là sự phát triển mạnh mẽ của công cụ RSI cổ điển, được phát triển dành cho các nhà giao dịch đánh giá cao sự chính xác và lọc tín hiệu thông minh. Với thuật toán làm mượt nâng cao, vùng thích ứng và phát hiện phân kỳ tích hợp, công cụ này cung cấp phân tích động lượng tinh tế cho tất cả các thị trường và khung thời gian.
🔍 Tính năng chính:
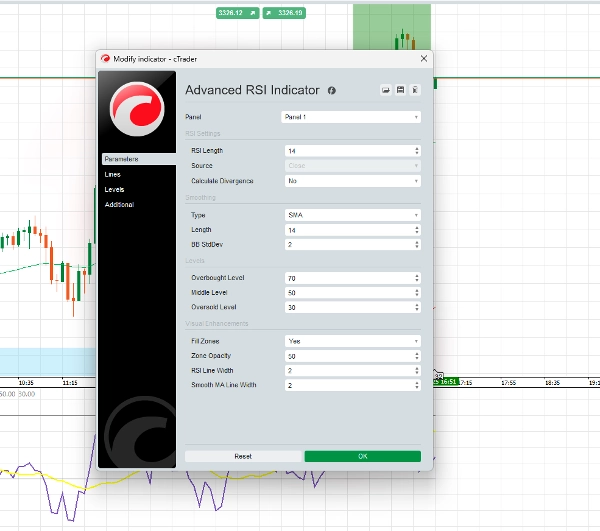
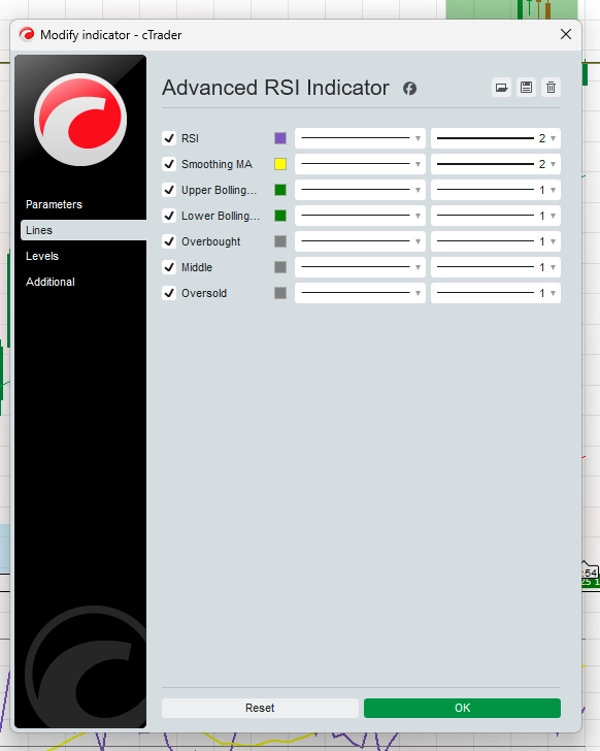
✅ Đường RSI được làm mượt
Giảm chuyển động giật cục và tín hiệu sai để có cái nhìn rõ ràng hơn về xu hướng thị trường.
✅ Vùng Tín hiệu Thích ứng
Vượt ra ngoài mức truyền thống 70/30 với ngưỡng động phản ứng với biến động thị trường.
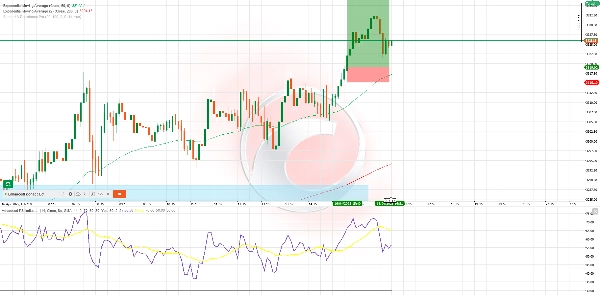
✅ Vùng Động lượng Mã màu
Đánh giá nhanh động lượng tăng hoặc giảm với thiết kế trực quan dễ hiểu.
✅ Cảnh báo Phân kỳ
Nổi bật các thiết lập phân kỳ tăng và giảm để hỗ trợ quyết định chiến lược.
✅ Hệ thống Cảnh báo Tùy chỉnh
Thiết lập cảnh báo cho các mức RSI và tín hiệu phân kỳ để bạn không bao giờ bỏ lỡ những thời điểm quan trọng.
✅ Đa Tài sản, Đa Khung thời gian
Tối ưu cho việc sử dụng trên forex, crypto, cổ phiếu, chỉ số và nhiều hơn nữa — từ biểu đồ M1 đến hàng ngày.
⚙️ Ví dụ Chiến lược – RSI Wave Ride
Phù hợp nhất cho: giao dịch swing H1 & H4
Các chỉ báo sử dụng: RSI Nâng cao, 50 EMA, 200 EMA
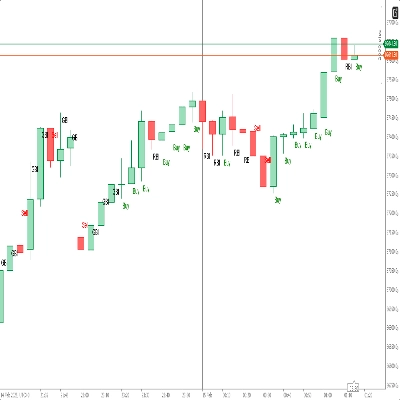
Ví dụ Mua:
- Giá nằm trên 50 & 200 EMA
- RSI giảm xuống dưới 40 và bắt đầu tăng
- Màu động lượng tăng xuất hiện
- (Tùy chọn) Phát hiện phân kỳ tăng
- Vào lệnh: Nến đóng cửa trên tín hiệu
- SL: Dưới đáy swing gần nhất
- TP: 1.5x–2x rủi ro hoặc kháng cự gần đây
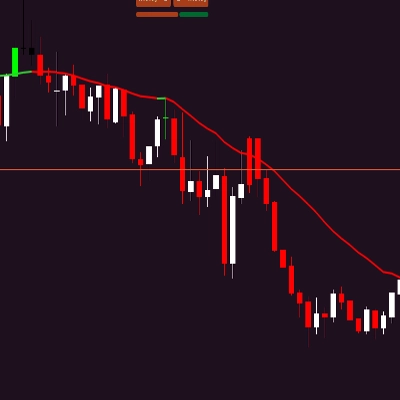
Ví dụ Bán:
- Giá nằm dưới 50 & 200 EMA
- RSI di chuyển trên 60, sau đó bắt đầu giảm
- Màu động lượng giảm xác nhận hướng đi
- (Tùy chọn) Phân kỳ giảm tăng thêm sức mạnh
- Vào lệnh: Nến xác nhận đóng cửa
- SL: Trên đỉnh swing gần nhất
- TP: 1.5x–2x rủi ro hoặc hỗ trợ gần đây
💬 Tại sao các Nhà giao dịch chọn Công cụ này:
- Dễ sử dụng, nhưng mạnh mẽ
- Tín hiệu không bị vẽ lại
- Đã được kiểm nghiệm trên các thị trường lớn
- Có thể sử dụng độc lập hoặc kết hợp với các chiến lược khác
Tóm tắt
Đánh giá của khách hàng
5 | 100 % | |
4 | 0 % | |
3 | 0 % | |
2 | 0 % | |
1 | 0 % |